|
  Statistics Measurements Statistics Measurements
The Statistics Measurement functions are
used to compute statistical estimators for the data in
Image Windows and
Plot Windows. For images, the data sample may include
the entire image or be limited to a rectangular region. For plots,
all plot series are used. The statistical estimator and parameters
are selected from the
Statistics Properties dialog and may range from
a basic quantity like the Mean to a more complex computation
such as SigmaClip or Skewness. For
Image Windows, the
Statistics Properties dialog provides the
option to save the statistics results to the image header; however,
the image must be saved to a file to permanently save the updated
header.
For Image Windows displaying an
Image Set, the
Image Cursor defines the same pixel region for all
images, thus using an identical region of each image without
re-positioning the cursor. Image Windows also provide the 'S'
keystroke shortcut. See the
Image Keys Pane.
Statistics Options
The statistics in the following table can be
selected for measurement using the
Statistics Properties dialog. When the result
is saved to the FITS header, the measurement region is added using
the S_REGION keyword and the estimator
and standard deviation are added using keyword names coded to fit
into the 8-character length of a FITS keyword. If a given keyword
already exists in the header, its value is updated with the new
statistic. For further information, see "Saving Statistics to the
FITS Header" under the
Statistics Properties topic. To remove all
statistics keywords from the FITS header, use the menu command
Measure > Statistics Properties > Remove
Statistics Keywords. The statistics measurements may be
listed using the
List Statistics Keywords command.
|
Properties of the Statistics Properties
dialog
|
|
Mean
|
Calculates the simple
average without any weighting or rejection of bad
values.
|
|
Mean - Geometric
|
Calculates the geometric
mean, which is a mean value weighted by the reciprocal of
the individual values.
|
|
Mean - Contra Harmonic
|
Calculates the weighted harmonic mean value in which each weight involves
the value raised to the p power.
|
|
Mean - Yp Power
|
Calculates the weighted mean
value in which the weight is given by the exponent p, which is the value raised to the
p power.
|
|
Mean - Alpha Clipped
|
Calculates a sample mean in which N(high) and N(low)
values are excluded from the sample.
|
|
Mean - Rank Clipped
|
Calculates a sample mean in which values outside
the percentiles %(high) and
%(low) are excluded from the
sample.
|
|
Mean - Sigma Clipped
|
Calculates a clipped mean in which values are
rejected if more deviant than ß(high)
and ß(low) above and below the sample
distribution mean. Refinement of the calculated mean value is
repeated up to specified maximum number of cycles. Use this method
when calculating the mean value in the presence of deviant values
that are outliers from a Normal distribution.
|
|
Mean - MTM Sigma Clipped
|
Calculates a clipped mean in which values are
rejected if more deviant than ß(high)
and ß(low) above and below the sample
distribution estimator. This computation includes both the mean and
median values of the sample distribution. Refinement of the
calculated mean value is repeated up to specified maximum number of
cycles. Use this method when calculating the mean value in the
presence of deviant values that are outliers from a Normal
distribution.
|
|
Mid Point
|
Calculates the midpoint
between the sample minimum and maximum values.
|
|
Median
|
Calculates the sample median (50th percentile).
|
|
Minimum
|
Calculates the minimum
values of the sample.
|
|
Maximum
|
Calculates the maximum
values of the sample.
|
|
Rank Percentile
|
Calculates the ranked
percentile value based on the %Rank parameter. For example, if %Rank = 50, then the 50th percentile, or median,
value is returned.
|
|
Standard Deviation
|
Calculates the Standard
Deviation about the mean value.
To calculate the standard deviation about a
specified value, check the Reference Mean box and enter the target
value.
|
|
Standard Deviation - Clipped
|
Calculates the Standard
Deviation in which the numbers N(high) and N(low)
values are excluded from the sample. The normal standard deviation
is also computed. The Estimator lists
the clipped standard deviation.
|
|
Std Err of the Mean
|
Calculates the Standard Error
of the Mean. This is the standard deviation divided by the
square root of the number of points in the sample, also known as
the "error of the mean." This statistic is used when comparing the
mean values for two different populations, such as the mean value
of one image to the mean value of another image. Comparatively, the
standard deviation measures the variation (or "scatter") of the
sample values (e.g., pixels) with respect to their own mean.
|
|
Std Err of the Mean - Clipped
|
Calculates the Standard Error
of the Mean in which values are rejected if more
deviant than ß(high) and ß(low) above and below the
sample distribution mean. Refinement of the calculated mean value
is repeated up to specified maximum number of cycles. Use this
method when calculating the standard deviation in the presence of
deviant values that are outliers from a Normal distribution. This
is the standard deviation divided by the square root of the number
of points in the sample, also known as the "error of the mean."
This statistic is used when comparing the mean values for two
different populations, such as the mean value of one image to the
mean value of another image. Comparatively, the standard deviation
measures the variation (or "scatter") of the sample values (e.g.,
pixels) with respect to their own mean.
|
|
Skewness
|
Calculates the statistical skewness to characterize the symmetry of the sample
distribution. A skewness value of 0 describes a symmetric
distribution. Skewness greater than 0 indicates a positive bias
("positive tail") and skewness less than 0 indicates a negative
bias ("negative tail").
|
|
Kurtosis
|
Calculates the kurtosis parameter, or relative weight of central
values to tail values in the sample distribution. The value is
adjusted to a reference value of 0 for the Normal ("Gaussian")
distribution. A kurtosis value greater than 0 indicates that the
distribution is taller than a Normal distribution (too narrow, or
"leptokurtic"). Conversely, a kurtosis value less than 0 indicates
the distribution is flatter than a Normal distribution (too flat,
or "platykurtic"). By definition, the Normal distribution has the
reference ratio of central area to tail area adjusted to 0, and is
called "mesokurtic".
|
Measuring a Single Image or Plot versus an Image Set
If an
Image Set is open in the
Image Window, you can choose whether to measure only
the currently displayed member of the image set or compute the
statistic for the entire image set. This is done using the
Measure Image Set button in the
Image Set Options group on the
Image Bar. When the button face shows a "1", then
only the current (one) image is measured, otherwise, the entire
image set is measured.
For
Plot Windows, all Plot Series are
measured.
Measurement Results
Results of statistics measurements are tabulated in
either a Statistics Measurements window used by all image
windows or a private
measurement pane owned by the Image
Window or Plot Window. These hold the measurements in a
Grid Control that includes menu commands for
activities like sorting, rearranging, copying, saving, graphing,
and opening in Microsoft Excel.
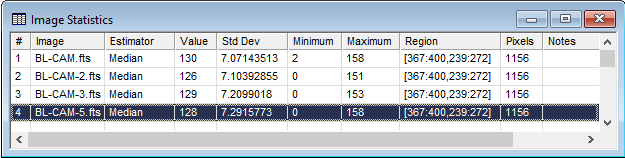
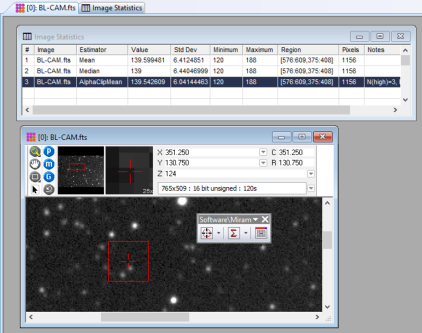
The first two examples below show statistics for an
Image Window. The first example shows a Statistics
Measurements window containing the Median value for members of an
Image Set. The second example shows a
measurement pane in which the
Statistics Properties were changed to compare
different estimators and parameters over the same rectangle in a
single image.
Image Statistics Report

Plot Statistics Report
The picture below shows the Statistics window
containing statistical estimators for the plot series in a
Plot Window. Each line corresponds to the calculation
for a different Plot Series. The Estimator listed in the table above is chosen from
the
Statistics Properties window, then calculated
using the Measure > Statistics
command from the pull-down menu or the button on the Image Measurements toolbar (Image
Windows) or
Plot Bar (Plot Window). One line is added to the
Statistics window for each plot series. You can mark most
results listed in the Statistics window on the plot using
the
Mark Statistics command of the Statistics
window. Some statistics cannot be marked, including the
Standard Deviation, Standard Error of the Mean, Skewness, Kurtosis,
Min, and Max.

The Statistics window grid columns are
described in the table below.
Statistics Report Grid Columns
|
#
|
The sequence number of the measurement.
|
|
Image
|
For
Image Windows, this is the name of the image.
|
|
Series
|
For
Plot Windows, this is the title of the plot
series.
|
|
Estimator
|
The name of the estimator used for the
measurement. If the measurement has parameters (e.g., "SigmaClip"),
then the parameters are listed in the Notes column. See
Statistics Properties.
|
|
Value
|
The value of the estimator. See
Statistics Properties.
NOTE: Some estimators such as Standard Deviation calculate the standard deviation
as the estimator; in these cases, the Value and Std Dev
columns are identical.
|
|
Std Dev
|
The standard deviation from calculating the
estimator.
NOTE: Some measurements do not calculate the
standard deviation (example: Minimum)
and insert the value "0" as a placeholder in the table. In
addition, the standard deviation and standard error calculations
duplicate the estimator in the Std Dev
column.
|
|
Minimum
|
The minimum value of the data sample.
|
|
Maximum
|
The maximum value of the data sample.
|
|
Region
|
Description of the pixel region that was
measured.
For images, the region uses the following
format:
[MinCol:MaxCol,
MinRow:MaxRow]
For plot series, there is only 1 row, so the
format is
[MinCol:MaxCol]
|
|
Pixels
|
The number of values sampled.
|
|
Notes
|
This column lists extra information such as the
estimator parameters. However, the Notes cells may be edited to change this
information or add other information. The Notes are included if you export the table to Excel
or a file.
|
When making many measurements or repeatedly
changing the
Statistics Properties, it may be advantageous
to detach the
Measurements Toolbar from the Mira window border and
move it over the
Image Window or
Plot Window, as shown below:
Related Topics
Measuring Images
Calculating Plot Statistics
Statistics Properties
List Statistics Keywords
Remove Statistics Keywords
Report Windows
Measurement Panes
Image Windows
Plot Windows
Plot Bar
Image Set
Image Cursor
Mira Pro x64 8.83 User's Guide, Copyright Ⓒ 2026 Mirametrics, Inc.
All Rights Reserved.
|


