 |


|


|
Plot Light Curve When an image set is measured using the Aperture Photometry package, this command is used to generate a light curve showing the variation in magnitude versus time. The target objects, standard stars, and check stars are selected according to their value in the Index column of the measurements grid. The plotted variables and error bar quantities are similarly selected from specific column titles in the measurements grid.
The values plotted are taken from data in the photometry results grid (the Apphot Pane or the related Photometry Measurements report window). The Object Numbers to Plot fields correspond to numbers in the "Index" column of the measurements grid. As shown above, they are entered as hyphen-separated ranges, separated by commas. In this example, the Targets are objects with index 1 and all objects with index in the range 3 through 9. The light curves are displayed in a
Plot Window that looks generally like those below.
The markers, colors, and trend lines for each group can be adjusted
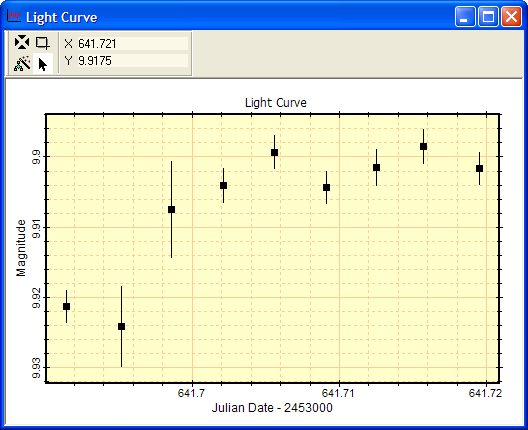
using the ExamplesThe window below shows a single standard star plotted with error bars. This light curve was produced by measuring an image set using the settings shown in the dialog box above.
The two plots below show multiple targets,
standards, and a check star. In the upper plot, notice that,
because of the magnitude spread, the error bars do not appear even
though the option to plot error bars was checked. In the lower
plot, the
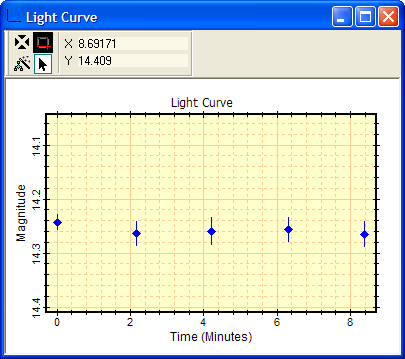
Notice that the top-most light curve for a target star has a marker that was changed to an open square after the plot was created, using the Plot Series Pane tool. The small vertical line inside the open square shows the magnitude error bars. The error bars for other points can be seen by enlarging the point. The plot below shows an enlarged view around the faintest standard star shown in the above plot.
PropertiesThe light curve is generated from Properties you enter into the Plot Light Curve Dialog. Objects to be plotted are specified using their Object number from the Apphot Pane To plot multiple objects, you can enter numbers separated by commas, like this: 1,2,5,12 or enter a sequence of numbers like this: 1-10. You can also mix the two formats, like this: 1,2,5,8-16,24. Plot Light Curve Properties
Related Topics
Mira Pro x64 8.83 User's Guide, Copyright Ⓒ 2026 Mirametrics, Inc.
All Rights Reserved. |
 button on the

 button to open the
 button was used to zoom in on
one of the standard stars. The following symbols have these
meanings: Black squares: Target Stars; Blue diamonds: Standard
Stars; Red line: a Check Star with error bars.
button was used to zoom in on
one of the standard stars. The following symbols have these
meanings: Black squares: Target Stars; Blue diamonds: Standard
Stars; Red line: a Check Star with error bars.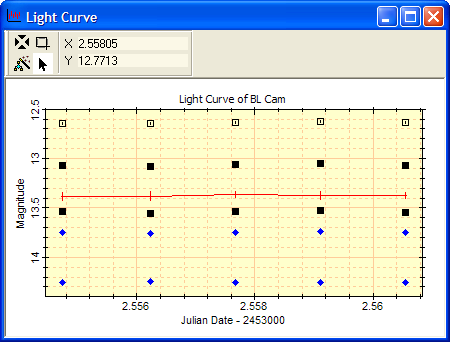
 Targets