|
|
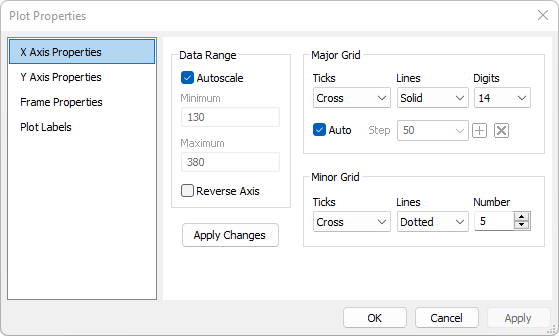
Plot Properties The Plot Properties dialog allows you to change the appearance of the plot. On the various pages of the dialog you can change the axis scaling, the tick marks, labels, fonts, colors, and more.
Page DescriptionsX Axis Properties configures the X axis extent, major and minor ticks. Y Axis Properties configures the Y axis extent, major and minor ticks. Frame Properties configures the appearance of the plot frame, including fonts, colors, and lines. Plot Labels configures the plot labels and captions.
Related Topics
Mira Pro x64 User's Guide, Copyright Ⓒ 2023 Mirametrics, Inc. All
Rights Reserved. | ||||||||


