|
|
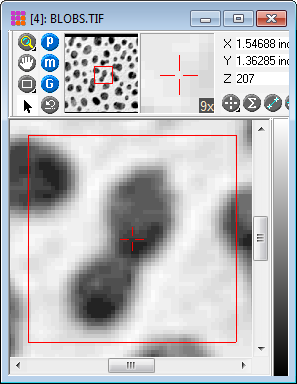
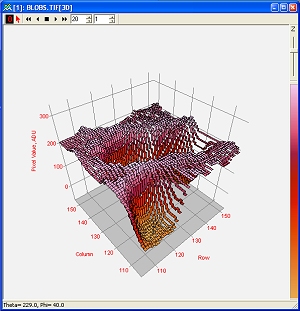
3-D Pixel Representations The pictures below describe some of the 3-D rendering options available using Mira. Settings were changed by clicking options in the 3-D Drawing Attributes window. This is the original image displayed in Mira and magnified 4X. The region inside the Image Cursor was rendered using the 3-D Surface Plot command. A section of that 3-D plot is shown below using various options available from the 3-D Drawing Attributes window.
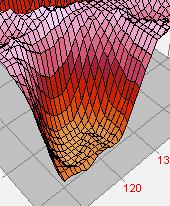
This shows an Intensity Surface plot in the full window. The Intensity Surface uses a palette like a 2-D Image Window to map the image intensity to Grayscale or color. The other examples, below, are obtained by changing the Plot Properties using the 3-D Drawing Attributes dialog.
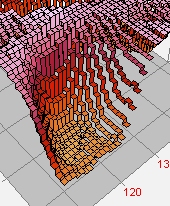
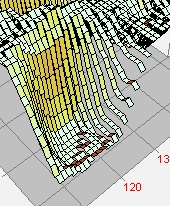
This Intensity Surface plot uses a Stepped Ribbon Pixel Representation with overlay Grid enabled. A pseudocolor palette is used to delineate by Z value. A Ribbon plot makes the rendering "transparent" in the column direction, meaning that you can view data at different row (Y) positions from any column (X) position.
The next example enables the overlay grid for the Intensity Surface plot shown above.
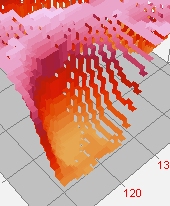
This Illuminated Surface was drawn with the Ribbon Pixel Representation. The Overlay grid was enabled. This representation connects pixels with a sloped facet, whereas the related Stepped Ribbon draws a horizontal cap on the pixel value with vertical facets on the pixel sides.
Intensity Surface Plot with Quadrilateral Pixel Representation and Overlay Grid enabled.
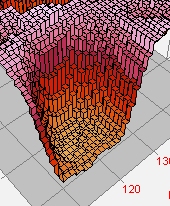
Intensity Surface Plot with Pedestal Pixel Representation and Overlay Grid enabled. This representation shows each pixel as a "column" of data in the Z direction.
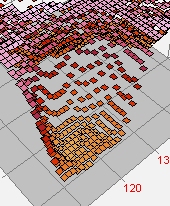
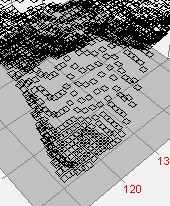
Intensity Surface Plot with Pixel Representation and Overlay Grid enabled. This shows only the top of the pixel, which reduces clutter between the Z values and also allows the plot to be "transparent" as viewed from all column and row directions.
Simple Wireframe Plot with Pixel Pixel Representation and Overlay Grid enabled. This makes a totally transparent plot with minimal clutter as viewed from any direction.
Related Topics
Mira Pro x64 User's Guide, Copyright Ⓒ 2023 Mirametrics, Inc. All
Rights Reserved. |


