|
|
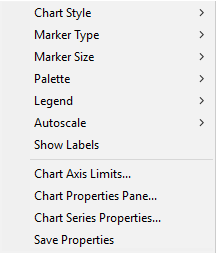
Chart Command Menu The Chart Command Menu provides commands for changing the data presentation and setting window properties. These commands generally change the properties for the entire chart. If the chart contains more than one data series, changes can be targeted to specific series using the Chart Series Properties... command.
Related Topics
Mira Pro x64 User's Guide, Copyright Ⓒ 2023 Mirametrics, Inc. All
Rights Reserved. | ||||||||||||||||||||||


