|
|
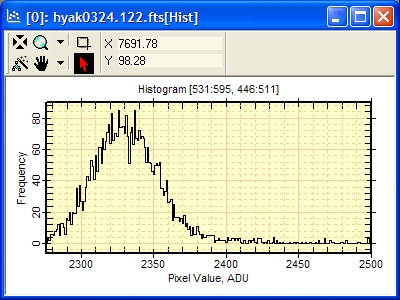
Comparison of Histogram Properties The Histogram Properties dialogs change the way the image data are binned into the histogram plot. The screen-shots below show the result of varying the Properties on the same sample of image data. This shows a sample of about 4000 pixels from an integer type image in which the sample includes a small number of very high pixels. After selecting a target image, the following sequence of commands was used to create this example:
This procedure was repeated for each different plot without changing the location of the image cursor. The results are given below:
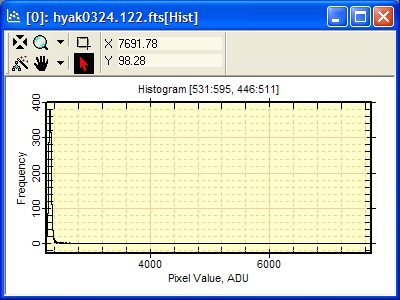
Bin Priority: Automatic. Range: Full Range. Only 1 or a few points of extremely high value push the majority of data into a small number of bins at the left.
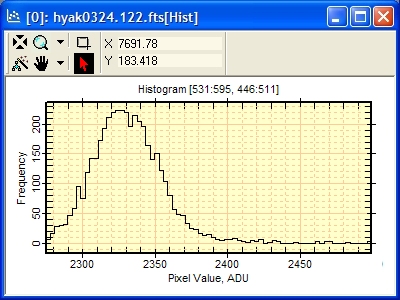
Bin Priority: Automatic. Range: Exclude lower 0.5% and upper 1.0%. Excluding the extreme values from the data sample allows auto binning to show more relevant information in the central portion of the frequency distribution.
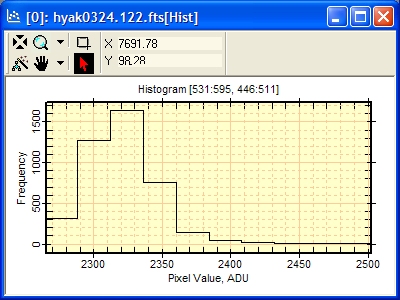
Binning: Bin Count=10. Range: Exclude the lower 0.5% and upper 1% of data.
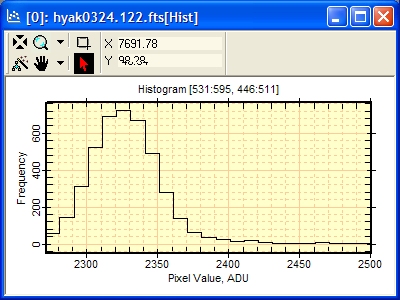
Binning: Bin Width=10. Range: Exclude the lower 0.5% and upper 1% of data.
Binning: Bin Width=1. Range: Exclude the lower 0.5% and upper 1% of data.
Related Topics
Mira Pro x64 User's Guide, Copyright Ⓒ 2023 Mirametrics, Inc. All
Rights Reserved. |


