|
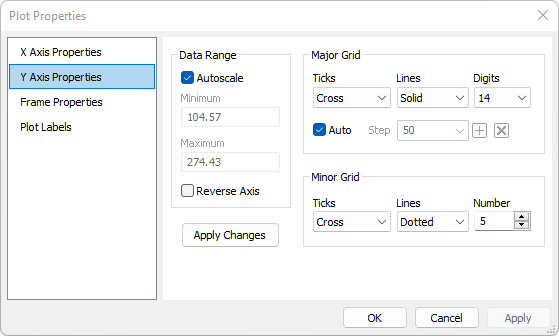
Y Axis Properties
|
|
Data Range
|
These properties control the extent of the Y
AXIS.
|
|
 Autoscale Autoscale
|
Check this box to autoscale the Y AXIS between the
minimum and maximum values of the data. If the box is unchecked,
enter your values into the Minimum
and Maximum fields.
|
|
Reverse Axis
|
Check this box to reverse the direction of the Y
AXIS.
|
|
[Apply Changes]
|
Immediately updates the plot using all
settings.
|
|
Major Grid
|
These properties control drawing a major grid
on the Y AXIS.
|
|
Ticks
|
Choose the type of major ticks drawn along the
axis edges:
None: No major grid
ticks are drawn on the Y axis.
Inside: Major grid
ticks extend inward from the plot box frame on the Y axis.
Outside: Major grid
ticks extend outward from the plot box frame on the Y axis.
Cross: Major grid
ticks extend across the plot box frame on the Y axis.
|
|
Lines
|
Select the type of lines drawn between major ticks
on opposite sides of the plot. The line width and color are set on
the
Plot Frame Properties page:
None: No major grid
lines are drawn on the Y axis.
Dotted: Draws dotted
lines for the major grid on the Y axis. Note: If the line width is
greater than 1 screen pixel, Windows ignores this selection and
draws solid lines.
Solid: Draws solid
lines for the major grid on the Y axis.
|
|
Digits
|
Select the number of digits of precision in the
axis labels.
|
|
Auto
|
Check this box to have the interval between major
Y AXIS automatically selected. If unchecked, enter the interval or
select it from the history list at right.
|
|
Minor Grid
|
These properties control drawing a major grid
on the Y axis.
|
|
Ticks
|
Choose the type of minor ticks drawn along the
axis edges:
None: No minor grid
ticks are drawn on the Y axis.
Inside: Minor grid
ticks extend inward from the plot box frame on the Y axis.
Outside: Minor grid
ticks extend outward from the plot box frame on the Y axis.
Cross: Minor grid
ticks extend across the plot box frame on the Y axis.
|
|
Lines
|
Select the type of lines drawn between minor ticks
on opposite sides of the plot. The line width and color are set on
the
Plot Frame Properties page:
None: No minor grid
lines are drawn on the Y axis.
Dotted: Draws dotted
lines for the minor grid on the Y axis. Note: If the line width is
greater than 1 screen pixel, Windows ignores this selection and
draws solid lines.
Solid: Draws solid
lines for the minor grid on the Y axis.
|
|
Number
|
Select the number of minor grid intervals per
major grid interval
|
Mira Pro x64 8.71 User's Guide, Copyright Ⓒ 2024 Mirametrics, Inc.
All Rights Reserved.