|
 Calculating Plot Statistics Calculating Plot Statistics
The
Plot Window includes tools for computing statistics
over the data plotted in the window. This calculation is initiated
by right-clicking the
Statistics Pane after computing a target
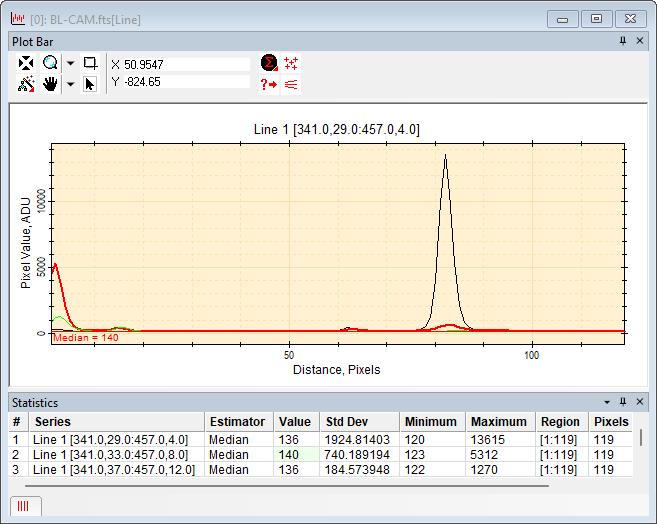
statistic. The picture below shows a
Plot Window containing several plot series plus the
median value computed from the data. The value is drawn in the plot
window next to a line representing the value of the
statisical estimator.
Procedure
-
Bring the target
Plot Window to the top of the window stack.
-
Select a statistical estimator to compute:
Right-click the  on the
Plot Bar or use the the Measure
> Statistics Properties submenu from the main
Plot Window menu at the top of the Mira desktop. In
the
Statistics Properties dialog, select the
statistic and set its parameters as needed. on the
Plot Bar or use the the Measure
> Statistics Properties submenu from the main
Plot Window menu at the top of the Mira desktop. In
the
Statistics Properties dialog, select the
statistic and set its parameters as needed.
-
Left-click the button
to compute the statistics for all plot series. The Statistics pane
will open containing the measurements.
-
In the Statistics
pane, left-click on the statistic you want to draw in the plot
window. In this example, the median statistic was selected for
series # 2. The target grid cell is highlighted in green.
-
In the Statistics
pane, right-click on the series you want to mark, then select
Mark Statistic from the pop-up
menu.
-
To plot a different statistic, repeat steps 7
through 9.
Related Topics
Statistics Measurements
Plotting Commands
Line Profile Plot
Image Plot Properties
Plot Series Pane
Mira Pro x64 8.71 User's Guide, Copyright Ⓒ 2024 Mirametrics, Inc.
All Rights Reserved.
|

