|
|
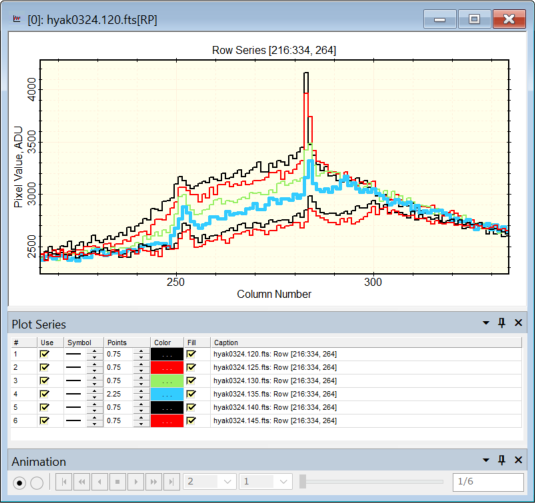
Plot Series Pane The Plot Series Pane command opens the Plot Series docking pane for viewing or changing the properties of lines and symbols used by the different plot series in the Plot Window. Use this pane to emphasize or hide specific series of data. Default values for the Plot Series Pane are set using the Image Plot Properties dialog. The screenshot below shows the Plot Series pane opened for a series of cross sectional plots near the nucleus of Comet Hyakutake (Comet C/1996 B2) included with the sample images (see these images opened as an image set in the Merge RGB Images topic). In the picture below, the plot for image hyak0324.135.fts was emphasized by increasing its line point size to 2.25 from the default 0.75.
Note that the text size shown in the grid may be changed using the Table Properties command in the right-click menu.
Setting the Properties of Multiple SeriesAs an alternative to setting properties to the same value across multiple series one at a time, a contiguous block of rows may be set to the same value. These commands are available in the right-click menu. This procedure involves setting one property as desired, then duplicating it to other rows. Procedure:1. Determine which block of cells you wish to change. The block must include contiguous rows with no gaps between. 2. Set the target value in the row at the top or bottom of the block, depending on whether you intend to copy cells up or down. 3. Mouse-down on the first cell and, without releasing the mouse, drag to the final cell of the block and release the mouse. 4. Right-click inside the highlighted rectangle to open the Series Properties Grid Menu (see below). In the menu, click the desired copy command. 5. Note: Be careful about copying the Caption as it is used to describe the plot series when they are viewed separately. Also note that Caption changes cannot be undone. Series Properties Grid MenuThe menus shown below open by right-clicking on the plot series grid. Most commands copy properties. Commands that with the word Properties copy all properties except for the Caption. The Table Properties command opens the dialog of that name where the fonts and other properties may be changed.The Optimize Columns command adjusts the column widths to minimum values.
Related TopicsPlot Series Default Properties Example: Changing Plot Series Pane
Mira Pro x64 8.71 User's Guide, Copyright Ⓒ 2024 Mirametrics, Inc.
All Rights Reserved. | ||||||||||||||||||||