|
Image Plot Properties
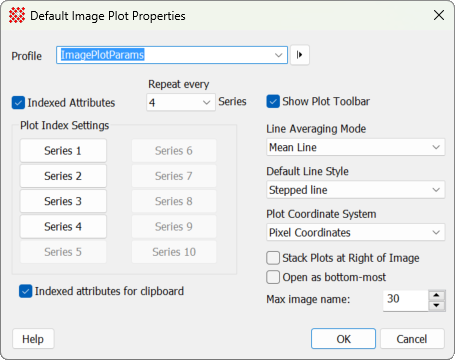
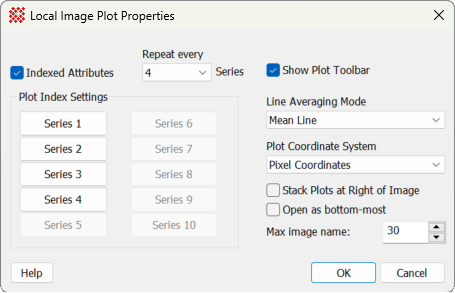
The Image Plot Properties dialog controls
the attributes of 1-dimensional plots created from data in
Image Windows. These properties can be changed
globally, to create default settings for new
Plot Windows, or locally, to affect only future plots
made from the current
Image Window. The default properties dialog uses a
profile control to save and recall parameter sets. Local properties
affect only the specific
Image Window for which they are changed.
|
Image Plot Properties
|
|
Profile [|>]
|
Selects the parameter profile for this command and
allows you to save or work with existing presets.
|
|
 Indexed Attributes Indexed Attributes
|
This options controls the choice of colors used
for different plot series. Check this box to use the available
color options for drawing successive plot series. If unchecked, all
plot series are drawn using the color of Series 1.
|
|
Series 1 .. Series 10
|
These buttons open the
Plot Series Default Properties dialog to set
the colors used to draw each of the plot series in cycles defined
by the Repeat every setting. The
specified colors for Series index 2 through 10 are used only if
Indexed Attributes is checked and
Repeat every is greater than 1.
|
|
Repeat every (Series)
|
Specifies the number of plot series per cycle of
the assigned colors. The colors specified on this page are repeated
every n series, where n is defined by the value in this field. This
is used only if Indexed Attributes is
checked.
|
|
Indexed Attributes for
Clipboard
|
Check this box to make plot series follow the
sequence of series attributes specified in this dialog when
performing a copy+paste from another
Plot Window.
|
|
Show Plot Bar
|
Uncheck this box to hide the
Plot Bar at the top of the
Plot Window. Check it to re-display the
toolbar after hiding it.
|
|
Line Averaging Mode
|
Specifies how adjacent lines in the image are
combined:
Mean Line: Adjacent
lines are averaged at each pixel coordinate.
Median Line: The
median value is calculated from adjacent lines at each pixel
coordinate.
Summed Line: The sum
of adjacent lines is calculated at each pixel coordinate.
Std Dev Line: The
standard deviation is calculated among adjacent lines at each pixel
coordinate.
|
|
Default Line Style
|
Selects the way points are connected within a line
plot. This is available only as a default setting that affects all
future line plots.
Stepped Line: Points
are connected with flat tops, like stair steps.
Connected Line:
Points are connected one by one, with angled line segments.
|
|
Plot Coordinate System
|
Selects whether images are plotted using pixel
coordinates (column, row) or
world coordinates.
|
|
Stack Plots at Right of
Image
|
Check this box to create plots in a cascading
stack to the right of the
Image Window. See the
Stack Plots at Right command.
|
|
Open as bottom-most
|
Check this box to open new plot windows belowall
other view windows, including
Image Window,
Report Windows, and others. Note: This option may be
useful when plots are not being stacked to the right of the
Image Window.
|
|
Max Image Name
|
Specify the maximum number of characters in the
image name to use in the plot caption. This is useful when working
with images having very long names.
|
Using Indexed Properties for Plot Series
Mira allows you to assign specific colors to every
n-th plot series. You also can assign other attributes such as line
thickness or marker shape to every n-th series. These attributes
apply to all plots, including Over-plotted Line Profiles, Column
and Row Profile plots, and so forth.
Setting Colors using Mira
To give all series the same color, un-check
the Use Indexed Colors box. This
gives all series the color of Series 1. To change the
colors of other series, check theUse Indexed
Colors box, set the Repeat
every counter as desired, and then click the Series n
button to set the colors. The value of Repeat every (n) series causes the series color
to cycle every (n) series.
Setting Series Properties (Colors, Symbols, Lines, etc.)
To give all series the same color, un-check
the Use Indexed Colors box. This
gives all series the color of Series 1. To change the
colors of other series, check theUse Indexed
Colors box, set the Repeat
every counter as desired, and then click the [Series (n)] button to set the colors. The value
ofRepeat every (n) series causes the
series color to cycle every (n) series.
Changing the Properties for an Existing Plot
To give all series the same properties, un-check
the Use Indexed Colors box. This gives all series the
properties of Series 1. To change the properties of
other series, check the Use Indexed Colors box, set the
Repeat every counter as desired, and
then click the Series n button to set the properties of
every n-th series. The value ofRepeat
every (n) series causes the series color to cycle every (n)
series. The button opens the
Plot Series Default Properties dialog.
|
Tip
|
When adding series using the Move [+] mode of the
Line Profile Plot, this feature is useful for highlighting each
additional series before you plot it. Determine which series will
be added by the move command, then set the desired color for the
appropriate series index in the Plot Properties dialog.
|
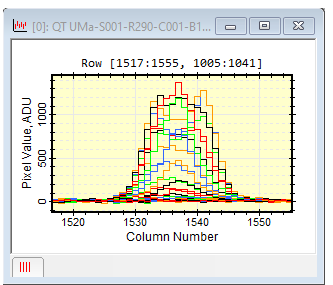
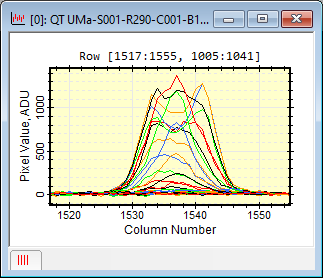
Selecting the Line Style
The Default Line
Style property changes the way line plots are drawn. A
connected line plot connects the points with line segments at
arbitrary angles. A stepped line plot uses only horizontal and
vertical segments. Set the default line style using View > Default Properties > Image Plots.
Compare the left and right pictures below.
Related Topics
Setting Application Properties
Plot Windows
Plot Animation Bar
Plot Series Default Properties
Plot Series Pane
Stack Plots at Right
Mira Pro x64 8.71 User's Guide, Copyright Ⓒ 2024 Mirametrics, Inc.
All Rights Reserved.
|

