|
|
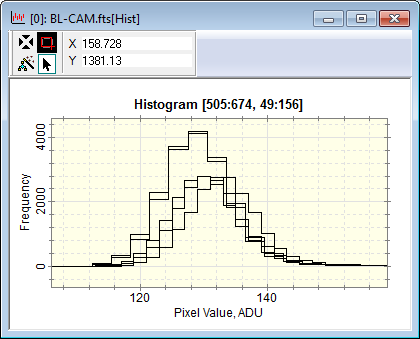
A Histogram Plot shows the frequency distribution of image pixel values by calculating the frequency distribution over a series of range bands, called "bins". This command plots the histogram for all pixels inside the image. Alternatively, to plot the histogram only for pixels inside the Image Cursor, use the Histogram Plot at Cursor command. The binning and range of the histogram can be set using the Histogram Properties dialogs. For intensity data (non RGB), Mira can choose the bin width and number of bins or use values you specify. For RGB data, Mira uses 256 bins. NOTE: The Histogram Plot often looks best when the Default line is Stepped Line option is checked in the General Properties dialog (Ctrl+R). World CoordinatesThe histogram shows the pixel value distribution within a rectangle around an image point. If the image has a World Coordinate System calibration, the world coordinates displayed in the Plot Bar show only the world coordinate position and pixel value at the center of the rectangle. Hence the world coordinates and pixel value to not change as the plot pointer is roamed around the plot. Creating a Histogram Plot
A typical histogram plot is shown below. This example shows the histogram of 5 images in an image set, over-plotted, so that all 5 images can be compared.
Procedure
Setting Other Histogram PropertiesSince the histogram is a type of plot, other properties of the plots can be set before or after the histogram is created.
Related Topics
Mira Pro x64 8.71 User's Guide, Copyright Ⓒ 2024 Mirametrics, Inc.
All Rights Reserved. |