|
 Line Profile Plot Line Profile Plot
A Line Profile is a graph of pixel values
versus distance along a line drawn on the image. A Line Profile
differs from a
Column Profile Plot and a
Row Profile Plot in that the sample line is drawn
manually using the mouse, In addition, the Line Profile
plots intensity versus distance on the x axis,
whereas a column or row profile plots intensity versus
position. To change the line ("marker") this command draws
on the image, see
Marker Properties. See
Creating a Line Profile for details about the
line profile plotting procedure.
World Coordinates
If the image has a
World Coordinate System calibration, moving the
pointer along the plot X axis reflects the world coordinates and
pixel values along the drawn line.
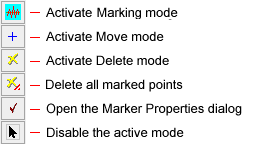
Line Profile Toolbar
Below is shown the Line Profile Toolbar,
which is a docking pane that controls most of the line profile
plotting functions. Note: Additional options are available from the
drop menu of the Line Profile button  on the main
Image Plot Toolbar. These are described in the topic
Creating a Line Profile. on the main
Image Plot Toolbar. These are described in the topic
Creating a Line Profile.
Additional properties may be set using the Line
Profile drop menu described below. above adds options to those on
the Line Profile Toolbar. It opens from the button on the main
Image Plots Toolbar.
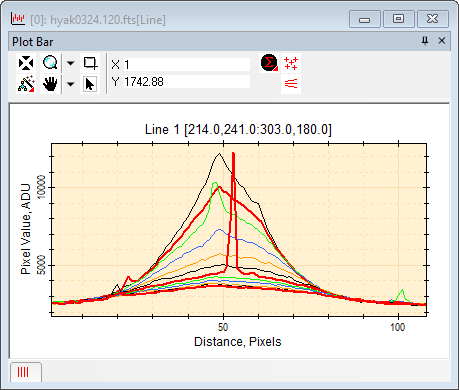
The Line Profile Plot
The line profile is drawn into a
Plot Window like that shown below. Notice that the
horizontal axis is distance, not an absolute position as used in
Column Profile and
Row Profile plots. The Plot Window below shows
multiple parallel profiles on the head of a comet. These were made
by switching to toolbar Move mode and
repeatedly dropping the profile line further along the long axis of
the comet head. The spike was caused by the profile line crossing a
star.
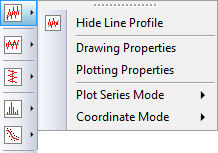
The Line Plot Menu
The Line Plot menu contains several
commands from the toolbar plus commands for changing the plot
properties.
Drawing a Line Profile Plot
The procedure below uses two modes for creating
line profile plots:
-
Mark mode creates a
line profile plot in a new
Plot Window. This creates the first plot of the
window's plot series.
-
Add mode adds one or
more parallel line profiles to the same
Plot Window. These profiles add to the Window's plot
series.
Procedure
-
Adjust the image to the desired scale, showing
the region to measure.
-
Click the button
on the
Image Plot Toolbar or use the Plot > Line Profile Toolbar menu command to open
the toolbar. Marking mode is automatically enabled when the toolbar
is first opened. To reactivate Marking Mode it, click the
 (mark) button at the top of the
toolbar. (mark) button at the top of the
toolbar.
-
Move the mouse to the starting point. Press and
hold down the left mouse button.
-
Tip: To draw a line
only in multiples of 45 degrees, press the SHIFT key and hold it before starting to
draw. Do not release the SHIFT key
until after releasing the mouse button at the end of the
line.
-
Tip: If Centroid
First Point is checked in the
Marker Properties dialog, the position will lock onto
the local centroid near where the mouse is released.
-
With the left button down, drag the mouse
pointer to the endpoint and release the button.
-
Tip: If Centroid
Last Point is checked in the
Marker Properties dialog, the position will lock onto
the local centroid near where the mouse is released.
-
Tip: The results are
displayed in a new
Plot Window.
-
To create additional line profile plots:
-
Tip: To create a new
profile in a new
Plot Window, repeat the previous two steps.
-
Tip: To add parallel
profiles to the
Plot Window containing the last plot marked (steps 3
-- 4), enter  (add) mode and click on a point
in the image. See Plotting Multiple Parallel
Line Profiles, below. (add) mode and click on a point
in the image. See Plotting Multiple Parallel
Line Profiles, below.
-
When finished drawing profile lines, you can
disable marking mode by clicking  on the
toolbar. on the
toolbar.
|
TIP:
|
To draw a line at a multiple of 45 degrees, press
the SHIFT key and hold it before
starting to draw. Do not release the SHIFT key until after releasing the mouse
button at the end of the line
|
Plotting Multiple Parallel Line Profiles
Multiple parallel line profiles may be added to an
existing
Plot Window by repositioning the line plot vector at
different image locations. The new profile will pass through the
new point. Each time you draw a line plot vector using (mark) mode, the line profile plot is drawn into
a new
Plot Window.
-
Press (mark) and
rubber-band the first line plot vector on the image. This draws the
line plot in a new
Plot Window as the first of a plot series of 1 or
more profiles.
-
Press (add) and click on
an image point through which you want the parallel line plot vector
to pass. The line profile adds to the plot series started by the
button.
-
Repeat step 2 to add parallel line profiles to
the
Plot Window.
-
To start a different line plot series in a new
Plot Window, repeat step 1 and, optionally, steps 2
and 3.
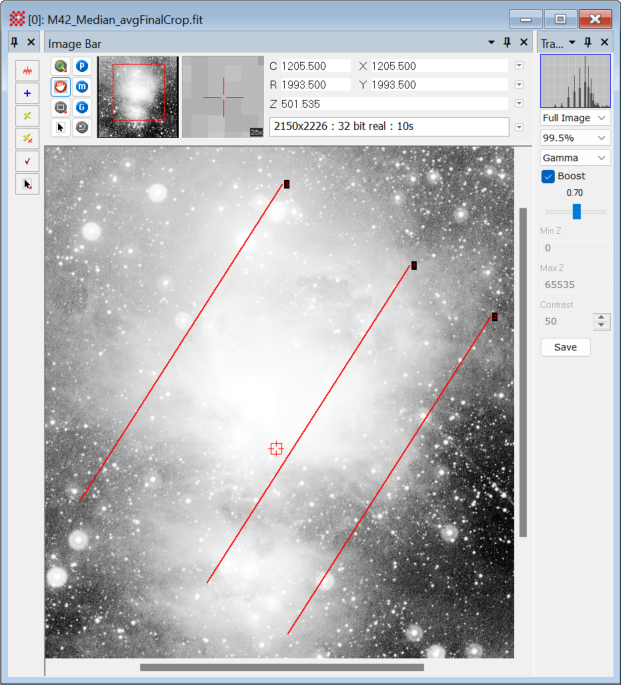
Example
The picture below shows an
Image Window with 3 parallel lines drawn using the
(mark) and (add) modes. First, the middle line was drawn
using the toolbar (mark) mode. After
switching to (add) mode, two parallel lines
were added by clicking on the image to the right and left of the
first line. The two additional points were chosen so that the
profiles would pass through bright stars.
The 3 lines drawn in the image created a plot
series of 3 line profiles in the
Plot Window shown below. The first profile created a
new plot series whereas the additional profiles added members to
the plot series. The picture below shows the profiles in
Overplot mode. Switching to
Animate mode displays each profile
separately, each with a unique title that lists the line endpoint
coordinates from the image.
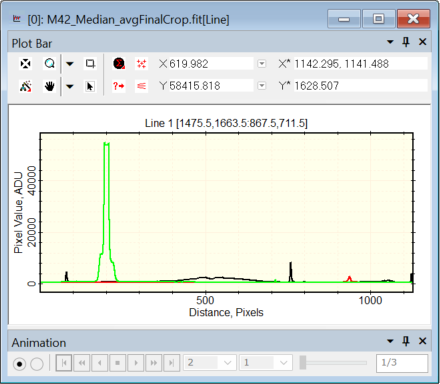
In this example, the plot series members are drawn
with equal line thickness in black, red, and green for series 1, 2,
and 3, respectively. For example, notice the green spike around
x=200 corresponding to the bright star near the beginning of line 3
drawn on the image. These properties can be changed before or after
creating the plots:
-
Before the first profile is drawn in a new
Plot Window, the series properties are set using the
Image Plot Properties dialog in the
View > Default Properties menu.
-
After the first profile is drawn, the series
properties can be altered using the
Plot Series Pane which is opened using Ctrl+Shift+A or by right-clicking in the
Plot Window.
Related Topics
Plotting Images and Data
Plot Windows
Line Profile Properties
Creating a Line Profile
Calculating Plot Statistics
Plot Properties
Column Profile Plot
Row Profile Plot
Marker Properties
Mira Pro x64 8.71 User's Guide, Copyright Ⓒ 2024 Mirametrics, Inc.
All Rights Reserved.
|

