|
Displaying Images
 |
- Display single images or image stacks, using 1 window or multiple
windows. Mira's image display and post-display image manipulation is
unmatched in PC software, saving you valuable time.
- Open
images having various data types: binary, 8 to 32 bits per pixel integer, 32
and 64 bit real, and RGB. Mira Pro x64 includes 5 RGB pixel
types from standard 24 bpp to 192 bpp real.
- Multiple
image blinking and animation, ranging from manual blinking to many
frames per second; works with any displayed image, regardless of size or bit depth.
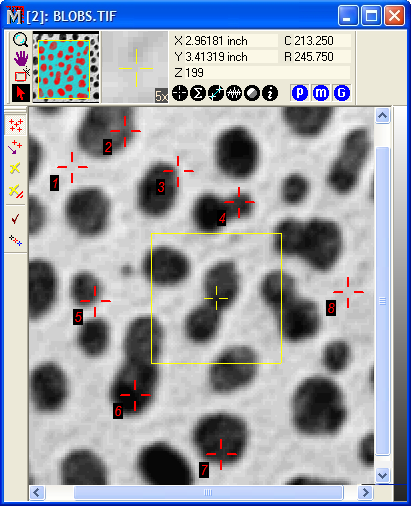
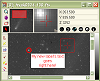
-
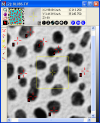
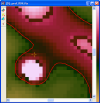
Monochrome, pseudo-color, and RGB color (images at left show luminance
data in grayscale and pseudo-color).
- Produce publication quality prints of displayed images using any
printer supported by Windows, including color printers. Printing
options include page scaling or specified size and placement, margin rulers, grid overlay,
header data, and user comments.
- Smooth, real
time contrast, brightness, and gamma stretching and other palette
changes. Works for one image or an image
stack, even during rapid image animation.
- Image
Bar control panel with thumbnail magnifier and full-image views;
provides coordinate readout and commonly used command buttons;
displays current settings.
- Zoom
ratios of 1/16 to 16x, live panning at any magnification, live image
cursor sizing and adjustment. You can even adjust these parameters and
the image palette during animation!
-
Animation Bar control panel for image sets; controls animation,
blinking, speed, frame selection.
- Overall,
Mira's image display and animation performance are unparalleled on the
Windows platform.
|
|
Visual Enhancements
(Palettes, Transfer
Functions)
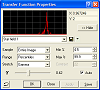 |
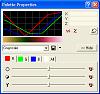
- Unparalleled
control of palette and transfer function options for superior
grayscale and pseudo-color enhancement.
- Interactive
adjustment of Palette R, G, and B, as well as total contrast and brightness
stretch in real time, even during high speed image animation.
- Create, modify,
delete, and rename standard palettes or your own palettes..
- Palette
selection includes dozens of pre-defined palettes Including
grayscale, random, and level-slice palettes, plus a selection of pseudo-color
palettes.
- Versatile
transfer function adjustment, with fine control over sampling, range
enhancement, and stretch parameters.
- Choice of
sample methods: entire image or cursor region.
- Choice of range
methods: Predefined percentile ranges, user-defined percentiles,
Min/Max, Z-Scale algorithm, and Z value limits.
- Choice of
scaling methods: Linear,
Logarithmic, and Gamma Power transfer functions; adjustable gamma
value.
- Make transfer
function adjustments for one or all images in a stack in real-time,
even during image animation.
|
|
Plotting

|
- Plot windows provide efficient
display of 1-D dimensional data. Toolbar operated plot zooming and
change of attributes.
- Each window plots 1 or more
series (e.g., multiple image rows)
- Adjust visible data window's position and magnification factor in
live mode for both axes, for each axis, in steps, or by marking a
rectangle of interest.
- View live cursor
coordinate readout using world coordinates in the spatial dimension, such as
mm or microns, if
the image is calibrated.
- Animation and over-plotting of multiple plot series. Animation modes
include single step, forward/backward, continuous, single pass, or
rock modes. The animation rate and series interval can be specified.
- Adjustable plot attributes for
x,y axes: min/max limits, reversed scale, major and minor tick styles,
tick count, etc.; changeable axis tics and labels, fonts, colors, background, grid, and title;
plot attributes can be configured as defaults before the plot or
changed after the plot.
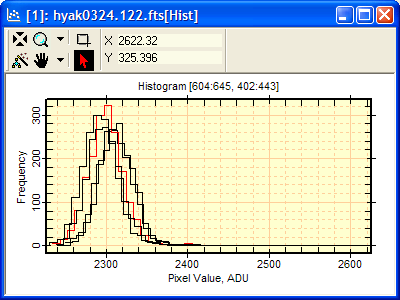
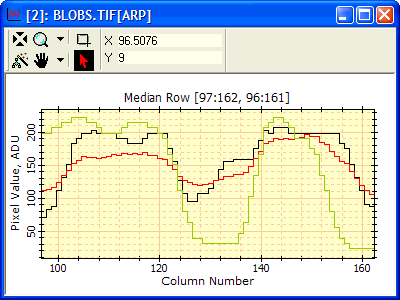
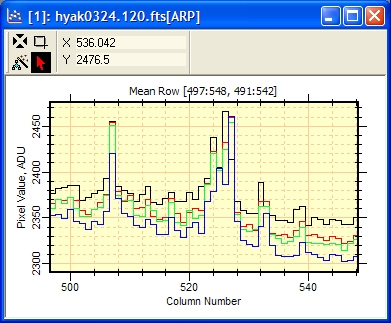
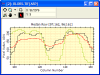
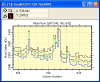
- Plot intensity
along an individual column or row or all columns or rows in a
rectangular region; plot a single image or an entire image stack.
- Plot an average line from the mean, median, or sum of rows or
columns inside a rectangular region; plot a single image or an entire
image stack.
- Plot data along
an angled line between two points, add plot series for parallel lines
perpendicular to the first.
- Copy/paste plot
series between plot windows, for example, to overplot a median intensity
slice over a range of rows.
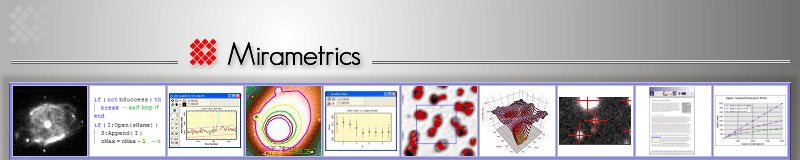
- Histogram of
pixel values inside a rectangular image region; choose automatic or
user-specified bin width, number of bins, total range, and other
parameters; plot histogram of a single image or an image stack.
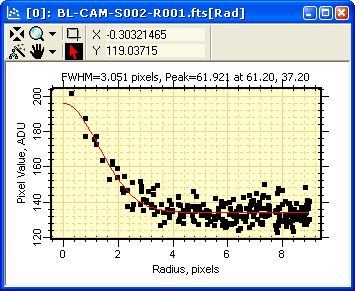
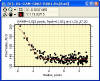
- Radial
brightness profile with a fit to a Gaussian + Constant model; gives
estimate the Full Width at Half Maximum (FWHM), peak value, and
background from fit.
- Plot
in pixel coordinates (column, row, value) or in world coordinates (mm,
microns, arcseconds, etc.) on the x0-axis; plot DN, ADU, Counts, or in
physical values on the y axis.
- Set line color and width, or symbol style, color, size and other
parameters may be configured before the plot or changed after the
plot. Series can also be hidden or displayed
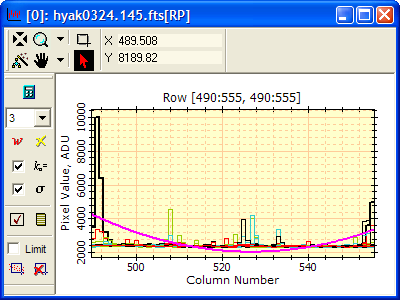
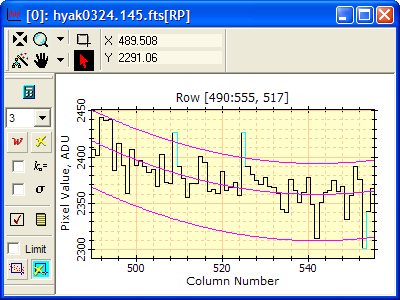
- Fit polynomial functions to 1 or more plot series, including sigma
rejection, data editing, region selection, and forced coefficients.
- View x, y pairs for all plot series, save to a text file, copy to
the clipboard, or print them.
- Produce publication
quality plots; copy the plot window data window to the clipboard for pasting into other applications such
as MS Word or a graphics arts application; plots can be
printed in color or converted to black & white.
|
|
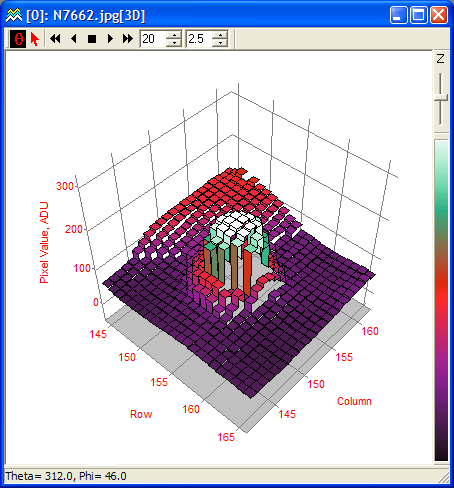
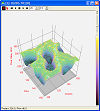
3D Visualization

|
-
Rapidly generate detailed 3-D renderings of
images having 8 to 64 bits per pixel. Use for
visualizing data and numeric models.
- Plot a single image or an entire image stack; when
plotting a stack, you can single step between
renderings or animate at a desired speed.
- Mouse operated tilt and rotation plus auto-timed surface rotation,
forward and backward at a selected speed. When an
image stack is rendered, the rotation, tilt, and
sequencing may be combined automatically or
manually.
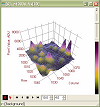
- Select from 4 plot types: 3-D intensity surface,
intensity wireframe, Illuminated Surface (Phong shaded),
or simple
transparent wireframe; the plot type is saved as a
default or may be changed after the fact.
- Select from 6 pixel representations: triangular or
quadrilateral facets, Stepped or piecewise ribbon,
pixel value only, or column plot.
- Apply grayscale or pseudocolor palettes as a
function of z-value or spot intensity.
-
Adjust the z-axis scaling relative to the palette or
using an absolute palette; the z value limits can be
automatic or user-defined; palette adjustmnet is
done in real-time.
-
Adjustable viewpoint position, Phong shading
parameters, selectable overlay grid, projection
planes, and axes.
|
|
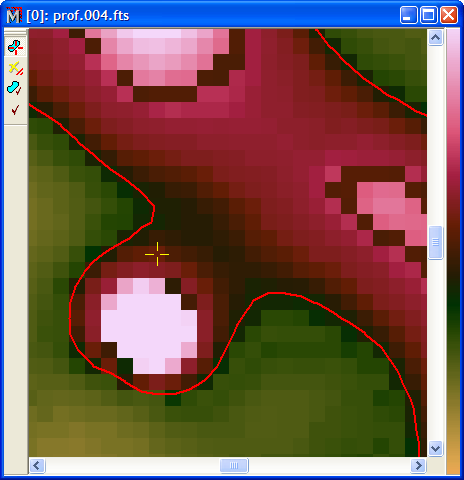
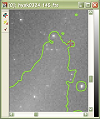
Contour Plotting

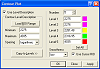 |
- Plot 1 to 100 contours in
Series Mode or Interactive mode.
- Series Mode: Select 1 to
100 contours, specifying contour values and colors. Specify the values
or allow Mira to calculate them using min/max values and an interval
function.
- Interactive mode: Draw
one or more contours at the image value where the mouse is clicked.
- Contour stiffness (smoothness) can be selected from 4 values to
smooth out noise or show every detail.
- Contour the entire image or a
rectangular region.
|
|
Image Cursor |
- Dedicated image cursor is independent of the live
mouse pointer used in roam mode and by toolbar commands; position, width, height,
and color is adjustable.
- Choose cursor styles from crosshair, rectangle, full-image
lines, or disable it.
- Cursor position and size stay where you place it; used for plotting, marking coordinate positions,
region statistics, etc.
- Live readout of pixel coordinate and world coordinate positions.
- Send
cursor to a pixel coordinate or a world coordinate position in the same or other
images.
- Pixel table editor shows ASCII text values for
pixels inside the cursor region, allows image editing, printing, or
saving of values to a file.
|
|
Image Calibration
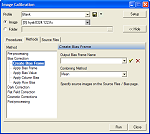 |
- Unique hierarchical calibration
tool performs any combination of standard data reduction processes for
image calibration.
- Choose from among any or all operations: create
master bias; apply bias frame, apply bias value, erase line,
polynomial or smoothed fitting of underscan or overscan columns or
rows; create master dark or dark time series; apply master dark or
dark time series; create master flat or filter series; apply master
flat or matched filter series; repair points, columns, rows, or
blotches; mask hot or cold pixels; remove cosmic ray detections. trim
underscan or overscan; rename files; add, replace, or rename header
keywords and values.
- Create, save, and modify
processing profiles that apply specific procedures and methods.
- Process 1 or more displayed images or
process image files to save time and memory.
- Select target images and
calibration frames using filename templates, file lists, or matched
keyword values.
- Automatically detect and repair cosmic ray events in an image set.
|
|
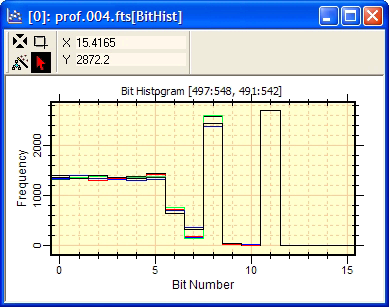
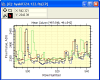
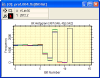
Image Diagnostics
|
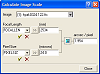
- Calculate CCD Camera Gain, Readout Noise
- Calculate Image Scale
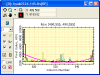
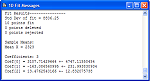
- Evaluate Camera A/D
Converter performance using Bit Histograms. The plot at left compares
5 images in a stack (1-click command) to show that all have the
desired almost-constant value in the noise bits.
|
|
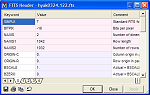
Image Headers
 |
|
|
Image Math |
- Operations
between images: add, subtract,
multiply, divide, blend (interpolate), and modulus (remainder).
- Operations between image
and a value: add, subtract,
multiply, divide, blend (interpolate), and modulus (remainder).
- Arithmetic
Operations: Change sign,
byte swap, logarithms, square root, reciprocal, modulus (remainder).
- Remove
scattered light and background irregularities using polynomial
surface flattening (1--100 terms, up to 10 x 10 including all cross
terms).
- Operations may
be performed between images having similar or dissimilar data types (
8 to 64 bit integer or real).
- All math operations are
supported on both numeric and RGB data type images.
|
|
Data
Types |
- Native data
formats: 8, 16, and 32 bit integer, 32 and 64 bit real, 24 bit color.
- reads and
writes FITS types with BITPIX = 8, 16, -16, 32, -32, and -64.
- Opens, saves,
displays, plots, measures, processes, and converts images of any data
type.
|
|
Image Combining
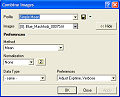 |
Increase S/N ratio, identify and analyze similarities and
differences between images, discover and characterize variable
sources and transient phenomena. Mira Pro x64 offers these 21 methods:
- Mean Methods: Arithmetic, Geometric, Modified
Trimmed Mean, Contra-harmonic Mean, Yp Mean.
- Clipped Mean Methods: Min Clipped, Max Clipped, Min/max Clipped,
Alpha Clipped, Rank Clipped,
Sigma Clipped, Mask by 0.
- Weighted Mean Methods: Values supplied by
a a keyword in the image headers.
- Ranking Methods: Median, Percentile,
Minimum, Maximum.
- Other Methods: Standard
Deviation, Sum, Range, Min/max Clipped Range.
Normalize as part of combining to make the statistics work correctly.
Choose scale or offset methods using a statistical reference in a
region of interest. Regional statistics include many of the combining
methods listed above.. |
|
Coordinate Calibration
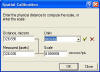 |
Mira Pro x64 provides tools for calibrating images in world coordinates that report x,y position in spatial units such as mm, or microns, as
well as angular coordinates. Both pixel coordinates and world
coordinates are reported in displays, measurements, and plots. Also
provided is luminance calibration to report physical units such as
ergs/sec/cm2, Kelvins, or microliters.
- Live cursor in displayed images and plots reports world coordinates
if the image is calibrated.
- Interrogate, measure, and plot image data using either physical (world)
coordinates or pixel coordinates.
- The world coordinate calibration can be computed or assigned using linear
distance units or angular units of arcseconds. Mira Pro x64 also loads
world coordinates from images calibrated with such.
- Mira Pro x64 reports accurate, sub-pixel precision coordinates for
measurements of point sources, plots, and
fiducial points; angles, distance, perimeter, area, and point
luminance using pixel coordinates or calibrated world coordinates.
- The Interactive calibration tool uses a physical length and
user-specified distance to create a world calibration.
- Spatial calibration can be saved with the image.
|
|
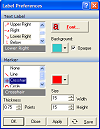
Markers & Labels
|
- Interactively
add markers to images with multi-line text labels.
- Choose from a
selection of marker styles, including crosshairs, circles, and lines.
- Choose position
of marker relative to location and select the font.
|
|
Spatial Filters
|
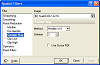
Mira Pro x64 provides a rich collection of filters
sharing many common properties such as adjustable kernel size,
elongation, and rotation, where applicable.
- Unsharp masking
and high pass filters for general sharpening, boxcar, elliptical, Gaussian,
block average. block sum (pseudo-binning), median, min, max, rank
percentile, clip high/low filters.
- Kobayashi filter for cosmic ray
removal.
- Digital
Development Processing (DDP) for emulating the response curve of
photographic emulsion. Mira Pro x64 includes Maximum Entropy processing
for enhancing sharpness while suppressing noise.
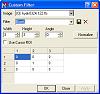
- Custom n x m
filter and 3x3 filters lets you design your own filter kernels.
- Rotational
Gradient for revealing asymmetries in round objects.
|
|
Measurements
|
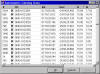
Measurements are reported in tabular form in a Report window, providing
the user a common interface and post-measurement functionality
regardless of the measurement type.
- Measure statistics over a region of interest or the entire
image (mean, median, min, max, standard deviation).
- Measure image coordinates with subpixel accuracy, manually or using moment
weighted centroid;
- Measure FWHM, peak, and local background using a Gaussian
profile +Constant model.
- Measure distance, position angle, and endpoint coordinates
between any two points.
- Measure polygon area, perimeter, and luminance statistics.
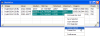
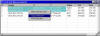
- All measurements are reported in tables in Report windows.
Reports share a common user interface. Table data may be exported to
editors or to applications such as MS Word®
or Excel®,
or it may be sorted, compared, or saved (see pictures at left).
Measurements are listed in pixel coordinates and also in celestial
coordinates if the image has a WCS calibration.
|
|
RGB Image Support
|
|
|
Geometric Transformations
 |
-
Perform precision Image Registration on any number of images of any data type; correct for drift and offsets between images or correct for
rotation, offset, image scale, unequal scale, and parallelogram deformations.
Performs auto pattern matching on point sets to calculate
the transformation equations.
-
Align automatically to absolute position when the images have world
coordinate calibrations.
-
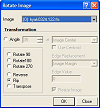
Apply sub-pixel accurate shifts, rotation, and scaling; flip
horizontal or vertical, rotate 90, 180, or 270° without re-sampling.
-
Scale uniformly or unequally in each axis (e.g., squaring pixels).
-
Crop images to specified dimensions and offset or, interactively, to a
specified rectangular region.
-
Expand image canvas; embed images into other images using opaque or
adjustable transparent insertion; apply offset value or random noise
to image border region.
-
Replace image pixels or regions with a value and optional Gaussian random noise.
-
Most geometric transformations update and retain any existing world
coordinate calibration.
|
|
Printing |
- Print images, plots, text, and measurement tables.
- Get publication quality results on any monochrome or color
printer supported by your Windows operating system.
- Set print scale, size, and location.
- Print rulers, grid overlay, and text comments.
|
|
Integrated Text Editor
 |
- Integrated Mira Text window for logging
of results and preparing reports. Text Windows may be created by Mira
commands to receive messages from processing functions or may be created
by the user.
- Mixes Mira messages and user content
that can be edited by the user.
- Supports copy/paste between windows or
from inside/outside Mira.
- Provides text find and replace, fonts,
colors.
- Window contents may be saved to a file,
opened from a text file, or printed.
- Printing capabilities include color,
fonts, margins.
|
|
Standard Image Formats |
- Opens and saves to TIFF, FITS, JPEG, and BMP standard formats.
- Camera formats: Princeton/Roper SPE format, Photometrics/Roper IMG format, Photometrics Star-1, SBIG
STx format, PixCel images, and Spectrasource Lynxx and other camera images.
- All CCD Camera image formats that save images in FITS or TIFF format.
- Mira Pro x64 provides a standard programming interface for using plug-ins to open files that have non-standard,
unsupported, or user defined formats. File
Open Plug-ins specify file filters that appear in the normal File | Open dialog. Plug-ins may be
written by Mirametrics, the Mira user, or acquired from other authors.
- Open and save unformatted binary images and ASCII text format images.
|
|
Expandability
|
- Standard Plug-in Interface; add plug-ins for opening new image format and for
processing images and image sets.
-
Scripting in Mira Pro x64.
|