Copyright © 2000. Mirametrics, Inc. All Rights Reserved.
Overview
The X-ray diffraction images shown in the figures below were sent by Dr. Masanori Hidaka of Kyushu University in Japan. Dr. Hidaka does CCD development which involves X-ray crystallography. Doing 3-D visualization using Mira is an important part of his work.
Note: This work used Mira Pro 6, circa 1999-2000, but the same features exist in newer versions.
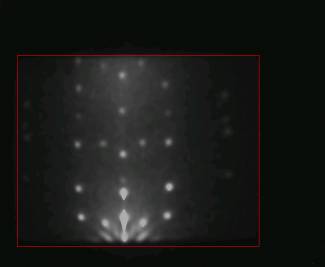
Figure 1.
This is the 2-D image plotted in 3-D below. The large rectangle outlines the Region of Interest rendered in Figures 4.
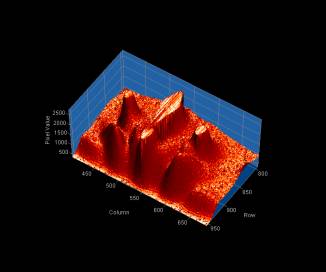
Figure 2.
Small region near bottom of image.
Parameters: 1x sampling, Phong shading, flame palette.
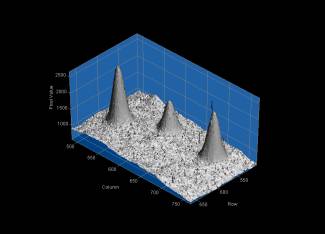
Figure 3.
Small region near center of image.
Parameters: 1x sampling, Phong shading, no grid overlay, grayscale palette.
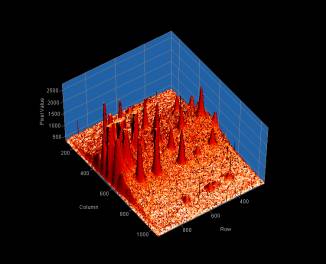
Figure 4.
Region of Interest from Figure 1.
Parameters: 2x sampling. Phong shading, flame palette. The light source was at 29º azimuth and 0º elevation (to the right of the observer).
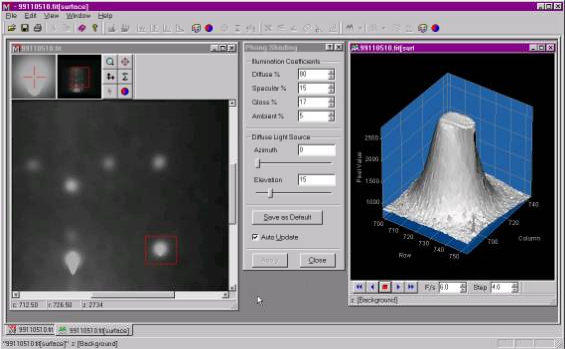
Figure 5.
Mira screen shot showing 2-D image, 3-D rendering, and Phong Shading control dialog (in the middle). The small red square on the 2-D image shows the region of interest that was plotted in 3-D. The toolbar at the bottom of the 3-D window is used to rotate the figure by single-step or by computer animation. This reveals extremely subtle features on the diffraction profile.