Contour Plotting
This
brief describes the contour plotting capabilities of
Mira Pro x64,
Mira Pro x64,
and Mira Pro.
Contour plots show
levels of constant intensity or luminance in an
image, much like a topographic map. With Mira, there
is no limit to the size of image, or the data type
(8 to 64 bits per pixel). Up to 100 levels may be
contoured in multi-contour mode or you can "click to
contour" at a single curve at a target luminance
level. Adjustable contour stiffness selects between
showing full detail and excluding noise — essential
for analyzing low S/N data. You can adjust the
number of contours, change the colors, and choose
auto-levels or contours at specific levels of your
choice.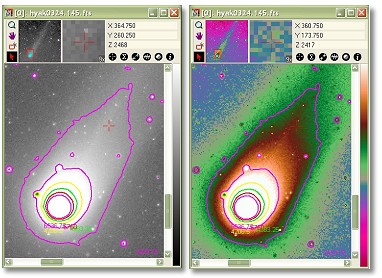 These examples show contours plotted on a grayscale image before
and after applying a pseudo-color palette enhancement. Notice how
the contour tracks luminance changes revealed so well by the
pseudo-color palette. However, they don't show exactly the same
thing. Contours trace through luminance values at the sub-pixel
level, considering neighboring values, whereas palettes select
only the pixel values as literally defined in the image.
These examples show contours plotted on a grayscale image before
and after applying a pseudo-color palette enhancement. Notice how
the contour tracks luminance changes revealed so well by the
pseudo-color palette. However, they don't show exactly the same
thing. Contours trace through luminance values at the sub-pixel
level, considering neighboring values, whereas palettes select
only the pixel values as literally defined in the image. |
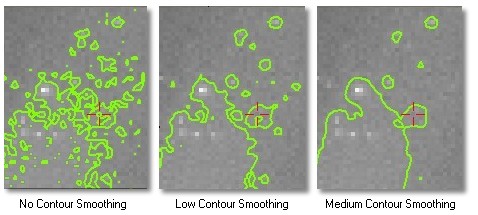
Adjusting Contour Stiffness, or "Smoothing"These examples show a single contour at a luminance level near the background. Since it has a very low Signal to Noise Ratio, the contour is subject to tracking noise. Mira allows you to select the stiffness of the contour following algorithm to trace fine details in high SNR data or coarse details in low SNR data.
|
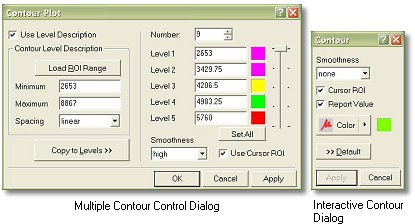
Mira Contour ToolsThese dialogs show how you create contours to meet your needs. The left dialog controls multiple contours as shown in the first example, above. The right dialog controls generation of single, interactive contours.
|