|
|
gaussdev (replaces TGaussDev) The gaussdev function returns a 1-dimensional array of random numbers distributed according to a Gaussian probability density function. These values are known as "Gaussian Deviates". The larger the number of values created, the more perfectly they will approximate a Gaussian normal distribution. Syntaxtbl = gaussdev( nCount ) tbl = gaussdev( nCount, nStdDev ) tbl = gaussdev( nCount, nStdDev, nMean )
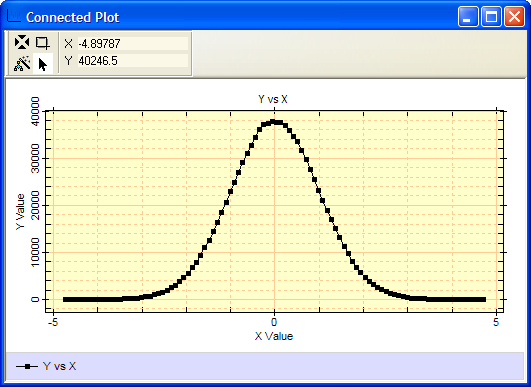
ExampleThe following script creates 1 million Gaussian random deviates, creates a histogram of the values, and plots the histogram. The random values are not symmetrical about the middle since they are drawn from a random population. To make this script brief, the default histogram binning option, "Auto", is used. The auto method computes the minimum and maximum of the values created and selects the number of bins between, Since these values are not specified, the script retrieves the histogram binning values actually used and then uses them for making the plot.
Below is the result of running this script. The plot uses default labels as they were not specified in this plot function call.
Related Topics
Mira Pro x64 Script User's Guide, v.8.76 Copyright Ⓒ 2024
Mirametrics, Inc. All Rights Reserved. |