|
|
CPlotView:Connect The Connect method creates a connected point plot by connecting markers with line segments between data points. This is a CPlotView class version of the non-class connect function. The x and y points at the same array index are presumed to correspond to the same point. This function also can plot x and y error bars. The data for x, y, x error bars, and y error bars are each held in a 1-dimensional array. The PlotConnected method takes its data from the CPlotView class data matrix rather than from x and y tables. Also see the Line, Scatter, and StepLine commands in the CPlotView class. This function creates a new plot window and returns a CPlot object for the plot series it creates. This object can be used to enhance or add to the plot or extract plot data for further analysis.
SyntaxCPlot = CPlotView:Connect( x, y ) CPlot = CPlotView:Connect( x, y, xe ) CPlot = CPlotView:Connect( x, y, xe, ye ) CPlot = CPlotView:Connect( x, y, xe, ye, sLabelX ) CPlot = CPlotView:Connect( x, y, xe, ye, sLabelX, sLabelY ) CPlot = CPlotView:Connect( x, y, xe, ye, sLabelX, sLabelY, sCaption ) CPlot = CPlotView:Connect( x, y, xe, ye, sLabelX, sLabelY, sCaption, sWindowTitle )
Return values:
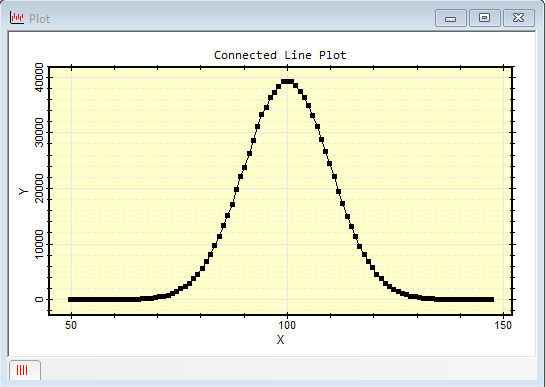
RemarksThe returned parameters permit access to the plotted data. You can also change the plot properties including the marker attributes, labels, scaling, and others using commands such as Series Attributes and Plot Attributes. Only the first 2 arguments, the (x,y) data, are required. If you want to use the other arguments, you must include a placeholder to fill any holes between the arguments. For example, to include y error bars but not x error bars, use nil in place of the xe parameter. ExamplesThe script below creates some data from the random number generator and creates a connected point plot with default plot labels. Since none of the optional parameters is used, only the x and y arrays need to be specified.
The second example, below, repeats the above plot but adds axis labels and error bars on the y axis.
Related TopicsComparison of non-Class Plotting Functions
Mira Pro x64 Script User's Guide, v.8.76 Copyright Ⓒ 2024
Mirametrics, Inc. All Rights Reserved. |