Analyzing Measurement Data
The following example shows an analysis of data taken from point measurements. We will assess whether there exists a trend in the Image Value with Y position. We do this by making a series of point measurements at various locations on the image, creating a scatter plot, and then performing a least squares analysis using the 1-d Fit package.
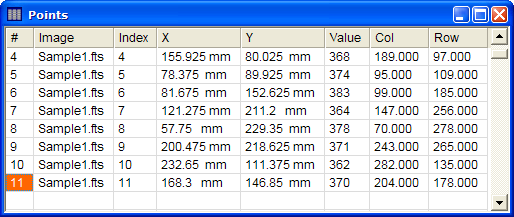
We assume the image has been displayed and a collection of Point Measurements has been made. These are accumulated in the Points Report window shown below. Notice that this image has a linear coordinate calibration in units of millimeters.
First, right-click on the Report window to open the Report Context Menu as shown below. We will plot all rows of data, therefore the Selection mode should not be set to Row mode.
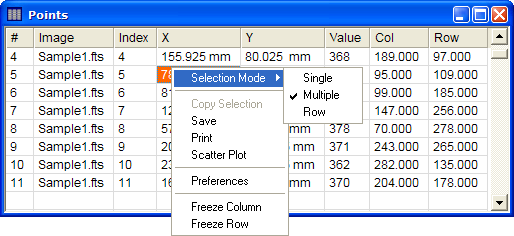
In the Report Context Menu, click the Scatter Plot command. This command is also available in the View pull-down menu. This opens the Scatter Plot dialog shown below.
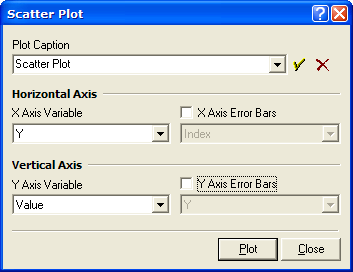
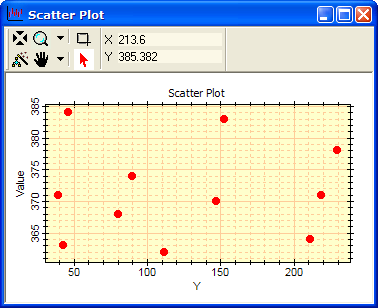
In the Scatter Plot dialog, select the data columns to plot. All columns of the Report window are listed in the 4 list boxes. In this example, select "Y" as the Horizontal Axis variable and "Value" as the Vertical Axis variable. Uncheck both of the Error bar option boxes as shown above. Enter a caption or select one from the history list in the dialog. Click [OK] to create the scatter plot:

The plot created by this command is a normal Mira plot in every way, so you can add other data, manipulate the plot, modify its labels, colors, or other appearance, and so forth (see Working with Plots). For example, the default window title is "Scatter Plot" but that may be changed using the Label Attributes page of the Plot Attributes dialog.
Before doing the least squares analysis, we will change the appearance of the plotted points. The plot we created uses the default attributes for the plot series. These attributes control the symbol shape, color, etc.. The default attributes are used when creating new plots. Here, we will change the series attributes after creating the plot.
Right click on the Plot Attributes ![]() button on the Plot Toolbar to open the
Plot Series
Attributes window. This will allow you to change the plot
symbol attributes. The scatter plot contains only a single plot
series, so the window contains only 1 line of attributes for that
series. The dialog opens with the default settings of the plot
series. Change the attributes to the settings shown below:
button on the Plot Toolbar to open the
Plot Series
Attributes window. This will allow you to change the plot
symbol attributes. The scatter plot contains only a single plot
series, so the window contains only 1 line of attributes for that
series. The dialog opens with the default settings of the plot
series. Change the attributes to the settings shown below:
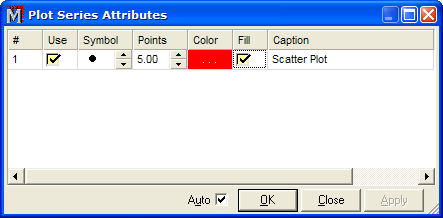
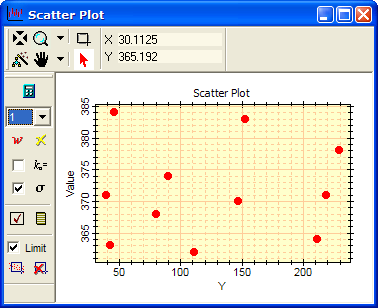
If the Auto box is checked on the Plot Series Attributes window, then the symbol attributes change in the Plot window as you change them. When the settings appear as shown above, click [OK] to close the window. The scatter plot now appears like this:
Next let us use the 1-d Fit package to determine the mean and standard deviation of the plotted values.
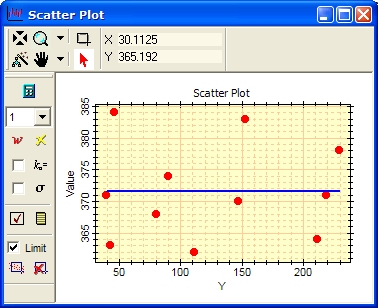
First, right click on the plot to open the Plot Context Menu. Then select the 1-d Fit command to open the 1-d Fit Toolbar. The Plot Window now looks like this:
These data do not show an obvious trend. Let's
calculate the mean value and standard deviation. Select the toolbar
options as shown above: Choose 1 coefficient from the listbox so
that only the mean value is calculated, and uncheck the ![]() to turn off sigma clipping of bad data. Click
to turn off sigma clipping of bad data. Click
![]() to compute the fit. The fit is always
drawn as a new plot series in addition to the existing plot
data:
to compute the fit. The fit is always
drawn as a new plot series in addition to the existing plot
data:
The fit results are listed in the 1-D Fit Messages window (a Text Editor) as shown below. From this you can see that the mean of the Values is 124.625 +- 7.553.
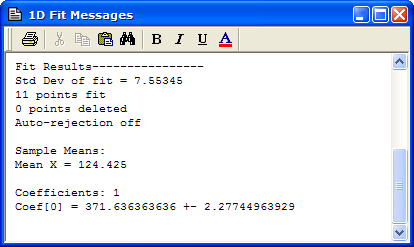
Now we will finish the analysis by assessing whether there exists a significant trend with the Y position (which is why we plotted Value against the Y coordinate). We need to fit 2 coefficients. On the 1-D Fit Toolbar, change the coefficient setting to "2" and recalculate to get the following result in the 1-D Fit Messages window:
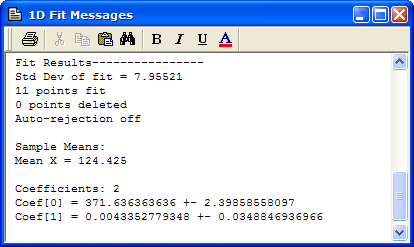
The value of the first order term, Coef[1], is far smaller than its error. There is no significant trend in these measurements.
Contents, Getting Started, Scatter Plot, Plot Windows, Working with Plots, 1-D Fit Package