Plot Windows
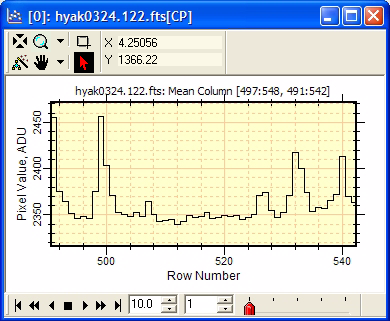
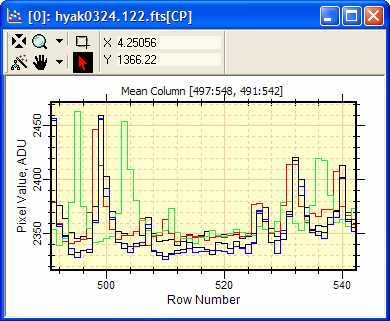
Plot Windows display 1-dimensional data in the form of a 2-d graph, or "plot". The different aspects of plotting in Mira are described in Working with Plots and topics referenced therein. The pictures below show a typical Plot Window with the Plot Toolbar at the top border and the Plot Animation Toolbar at bottom border. The Plot Toolbar can be shown or hidden using the Toolbar command in the Plot menu or the option on the Plot Preferences page. In the second picture, the window is changed to Overplot mode using the command in the Plot Context Menu.
Plot window with 5 series in Animate mode. In this mode, only 1 series is displayed at one time. The Plot Animation Toolbar is on the bottom border.
Plot window with 5 series in Overplot mode. This shows all plot series at the same time.
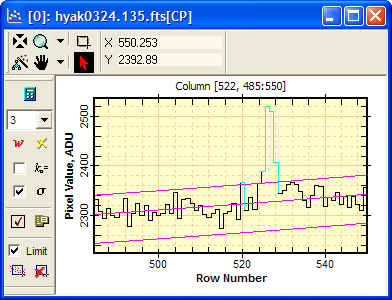
Plot window showing 1-D Fit Package on the left border.
Examples showing variations on Row Plots.
The Plot Window provides a number of toolbars for working with the plotted data.
The top border of the Plot Window has a Plot Toolbar which acts as a control center for working with the displayed data. This is similar in function to the Image Toolbar of an Image Window. The Plot Toolbar has buttons for changing the appearance of the data and a coordinate readout which is continuously updated when the mouse pointer is over the Plot Window.
If multiple plot series are graphed but displayed individually, the bottom border shows the Plot Animation Toolbar. The Plot Animation Toolbar lets you step through or animate through Plot Series in the same way the Image Animation Toolbar interacts with an Image Set.
In the lower picture, above, the left border shows the 1-D Fit Toolbar belonging to the 1-D Fit Package. This toolbar provides complete facilities for performing polynomial fitting of any data displayed in the plot window. One or more plot series may be fit together. The picture above shows one series being fit by a second order polynomial of 3 terms (purple). Also shown are upper and lower sigma-clipping limits, and the sigma-rejected points (turquoise).
All of the profile plots show image luminance versus position or distance. For these types, Mira also provides the following coordinate system options:
Coordinate Axis:
The Pixel Coordinates option measures pixel position in column or row [number].
The World Coordinates option measures position in world units such as cm, microns, or other units. If the calibration uses Celestial Coordinates (RA, Dec), then the plot uses [arcseconds] in a relative sense.
To change the default setting, see Plotting in World Coordinates.
Luminance Axis:
Luminance is displayed on the vertical axis of a profile plot and the horizontal axis of a histogram plot. The Luminance Axis label includes the units of luminance if the image header contains such information.
Plot Preferences control how the plot is created from the image. This includes, for example, whether Pixel or World Coordinates are used and what colors are used for multiple plot series. These settings are changed in the Plot Preferences page of the Mira Preferences dialog.
Plot Attributes control the way the finished plot is displayed. You can change the axis scaling, colors, fonts, labels, tick marks, and other attributes using the pages of the Plot Attributes dialog.
Series Attributes define the way the data in the plot series are displayed. This includes the size, color, and style of markers and lines. You can also set default attributes before plots are created, in addition to changing the series attributes after plots are created.
Mira provides the ability to to sophisticated polynomial fitting of any data displayed in a Plot Window. The 1-D Fit Toolbar controls the entire process.
Right clicking inside a Plot Window opens a Context Menu containing some useful commands.
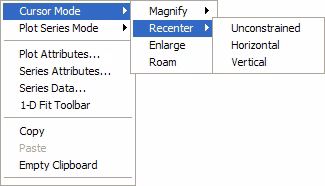
The commands in the Context Menu are a subset of those in the Plot menu on the Image window's menu bar.
Accelerators in the table below execute commands when a Plot Window has focus.
|
Plot Accelerators |
|
|
Ctrl+A |
Opens the Plot Attributes dialog for setting the preferences for the Plot window and the plotted data. |
|
Ctrl+C |
Executes the Copy command, which copies the window's plot series to the Windows clipboard. |
|
Ctrl+N |
Executes the New command, which displays the New Document dialog. |
|
Ctrl+O |
Executes the File > Open command, which displays the Open dialog. |
|
Ctrl+P |
Prints the Plot Window. |
|
Ctrl+R |
Opens the Mira Preferences dialog. Here you can set global preferences for working with images and plots, as well as other aspects of the user interface. |
|
Ctrl+V |
Executes the Paste command to paste plot series from the clipboard into the current Plot Window. |
|
Ctrl+X |
Open the Plot Series Attributes dialog. |
Working with Plots, Plotting Commands, Printing Plots, Plot Toolbar, 1-D Fit Package, Plot Animation Toolbar, Image Windows