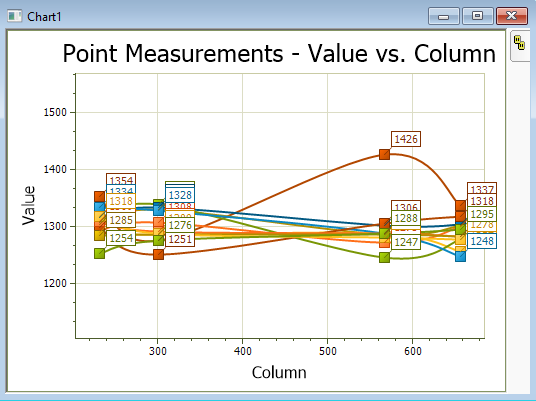
Chart Windows
Chart Windows show presentation quality graphics for data in the table of a Grid Control. You can also create presentation graphics inside Microsoft Excel after exporting the Mira grid data using the Open Table in Excel command. A typical Chart is shown in the 2 pictures below. In this example, 4 point measurements were made for the 12 images of an Image Set. The measurements were listed in a Report Window and then plotted using the Create Chart from Table Data command of the Report Window. They were grouped by image name as listed in the measurement table to produce 12 plot series connected by a spline curve. The second image shows the same chart with the Chart Legend enabled. Point value labels were enabled using the option in the Chart Command Menu (see below). The chart display attributes can be changed using options in the Chart Command Menu which is opened by right-clicking inside the chart.
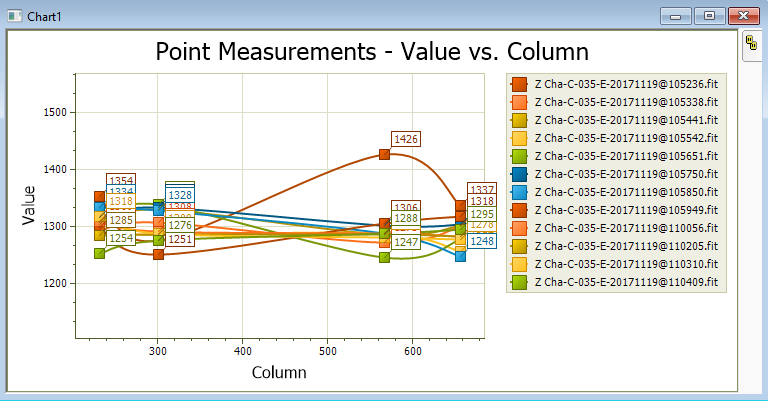
Chart Command Menu, Chart Legend Properties, Chart Axis Limits, Chart Properties Pane, Chart Series Properties, Chart Titles, Create Chart from Table Data, Grid Controls, Plotting Commands