![]() Statistics
Measurements
Statistics
Measurements
The Statistics Measurement tool is used to compute the value of a statistical estimator for pixels within a rectangular image region. The estimator is selected from the Statistics Properties dialog and may range from a basic quantity like the Mean to a more complex computation such as SigmaClip or Skewness.
To make a Statistics measurement, bring the
Image Window to the
top and adjust the Image
Cursor to enclose the target region, then click the ![]() button on the Measurements Toolbar or use the Measure >
Statistics command from the menu.
button on the Measurements Toolbar or use the Measure >
Statistics command from the menu.
This command is also operated using the 'S' keystroke command.
This command uses the Image Cursor to permit profile plots within the same region without having to re-position.
If an Image Set is open in the Image Window, you can choose whether to measure only the currently displayed member of the image set or compute the statistic for the entire image set. This is done using the Measure Image Set button in the Image Set Flags group on the Image Bar. When the button face shows a "1", then only the current (one) image is measured, otherwise, the entire image set is measured.
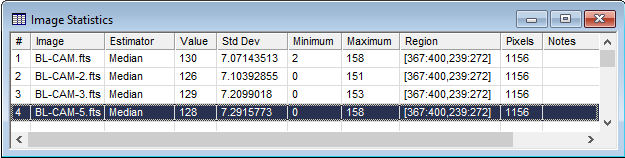
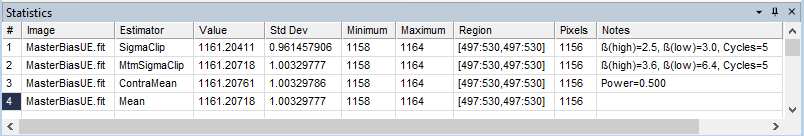
Results of statistics measurements are tabulated in either a Statistics Measurements window used by all image windows or a private measurement pane owned by the Image window. These hold the measurements in a Grid Control that includes menu commands for activities like sorting, rearranging, copying, saving, graphing, and opening in Microsoft Excel. Below, the first example below shows a Statistics Measurements window containing the Median value for members of an Image Set. The second example shows a measurement pane in which the Statistics Properties were changed to compare different estimators and parameters over the same rectangle in a single image.
The measurement table columns are described in the table below.
Statistics Quantities
|
# |
The sequence number of the measurement. |
|
Image |
The name of the image that was measured |
|
Estimator |
The name of the estimator used for the measurement. If the measurement has parameters (e.g., "SigmaClip"), then the parameters are listed in the Notes column. |
|
Value |
The estimator value. |
|
Std Dev |
The standard deviation of values inside the region. Note: Some measurements do not calculate the Standard Deviation (example: Minimum) and will insert the value "0" as a placeholder in the table. |
|
Minimum |
The minimum value inside the region. |
|
Maximum |
The maximum value inside the region |
|
Region |
Description of the pixel region that was measured. This description uses the following format: [MinCol:MaxCol, MinRow:MaxRow] |
|
Pixels |
The pixel count inside the region. |
|
Notes |
Initially, this contains information about the estimator parameters. The cells containing Notes may be edited to change this information or add details about the particular measurement. |
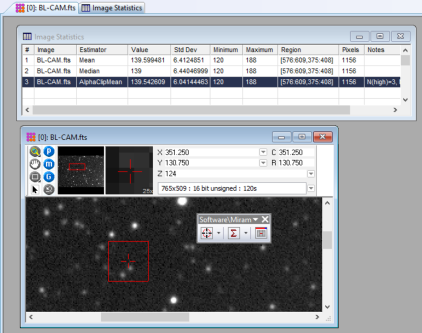
When making many measurements or repeatedly changing the properties, it may be advantageous to detach the Measurements Toolbar and move it onto the image, as shown below:
Measuring Images, Statistics Properties, Report Windows, Measurement Panes, Image Set, Image Cursor