|
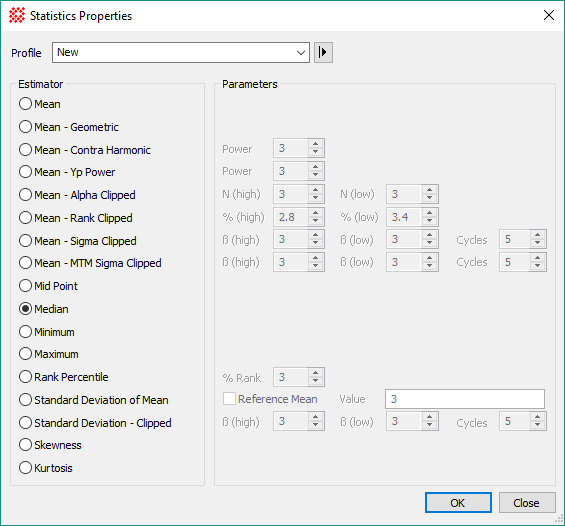
Properties of the Statistics Properties
dialog
|
|
Mean
|
Calculates the simple average with no weighting or
rejection of bad values.
|
|
Mean - Geometric
|
Calculates the geometric mean, which is a
mean value weighted by the reciprocal of the individual values.
|
|
Mean - Contra Harmonic
|
Calculates the weighted harmonic mean value
in which each weight involves the value raised to the p
power.
|
|
Mean - Yp Power
|
Calculates the weighted mean value in which the
weight is given by the exponent "p", which is the value raised to
the p power.
|
|
Mean - Alpha Clipped
|
Calculates a clipped mean in which a specified
number N(high) and N(low) values are excluded from
the sample.
|
|
Mean - Rank Clipped
|
Calculates a clipped mean in which the specified
percentiles %(high) and %(low) of values are excluded
from the sample.
|
|
Mean - Sigma Clipped
|
Calculates a clipped mean in which values are
rejected if more deviant than ß(high) and ß(low)
above and below the sample distribution mean. Refinement of the
calculated mean value is repeated up to specified maximum number of
cycles. Use this method when calculating the mean value in the
presence of deviant values that are outliers from a Normal
distribution.
|
|
Mean - MTM Sigma Clipped
|
Calculates a clipped mean in which values are
rejected if more deviant than ß(high) and ß(low)
above and below the sample distribution estimator. This computation
includes both the mean and median values of the sample
distribution. Refinement of the calculated mean value is repeated
up to specified maximum number of cycles. Use this method when
calculating the mean value in the presence of deviant values that
are outliers from a Normal distribution.
|
|
Mid Point
|
Calculates the midpoint between the sample minimum
and maximum values.
|
|
Median
|
Calculates the sample median (50th
percentile).
|
|
Minimum
|
Calculates the minimum values of the sample.
|
|
Median
|
Calculates the maximum values of the sample.
|
|
Rank Percentile
|
Calculates the ranked percentile value based on
the %Rank parameter. For example, if %rank = 50, then the
50th percentile, or median, value is returned.
|
|
Standard Deviation of Mean
|
Calculates the Standard Deviation about the
mean value. To calculate the standard deviation about a specific
mean value, check the Reference Mean
box and enter the target mean value. Otherwise, the ordinary
standard deviation is calculated.
|
|
Standard Deviation - Clipped
|
Calculates the Standard Deviation in which
values are rejected if more deviant than ß(high) and
ß(low) above and below the sample distribution mean.
Refinement of the calculated mean value is repeated up to specified
maximum number of cycles. Use this method when calculating the
standard deviation in the presence of deviant values that are
outliers from a Normal distribution.
|
|
Skewness
|
Calculates the statistical skewness which
characterizes the asymmetry of the sample distribution. Skewness
greater than 0 indicates a positive bias and skewness less than 0
indicates a negative bias.
|
|
Kurtosis
|
Calculates the relative weight of central values
to tail values in the sample distribution. The value is adjusted to
a reference value of 0 for the Normal distribution. Kurtosis
greater than 0 indicates that the distribution is taller than a
Normal distribution (too narrow, or "leptokurtic") while a value
less than 0 indicates the distribution is flatter than a Normal
distribution (flatter, or "platykurtic"). By definition, the Normal
distribution has the reference ratio of central area to tail area,
and is called "mesokurtic".
|
![]() button on the Measurements
Toolbar. The Profile Control facilitates saving and retrieving
estimators and their parameters.
button on the Measurements
Toolbar. The Profile Control facilitates saving and retrieving
estimators and their parameters.