![]() Histogram
Plot
Histogram
Plot
A Histogram Plot shows the frequency distribution of values inside the Image Cursor. More specifically, the histogram counts the number of occurrences of values within a range value, called a "bin". The binning and range of the histogram can be set using the Histogram Properties dialogs. For intensity data (non RGB), Mira can choose the bin width and number of bins or use values you specify. For RGB data, Mira uses 256 bins.
To make a histogram plot, use the Plot > Histogram menu command or click the
![]() button on the toolbar.
button on the toolbar.
This command is also operated using the 'I' (histogram) keystroke command for pixels inside the Image Cursor.
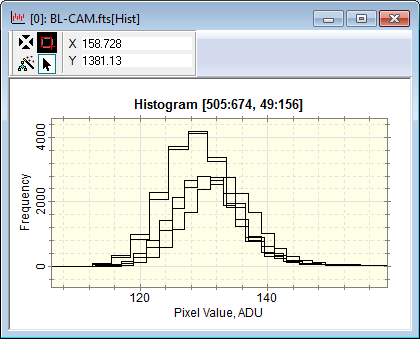
A typical histogram plot is shown below. This example shows the histogram of 5 images in an image set, over-plotted, so that all 5 images can be compared.
Adjust the Image Cursor to enclose the sample region.
Set histogram binning and range using the Default Properties command in the View > Default Properties > Histogram command .
Use the Plot >
Histogram menu command or click the ![]() button.
button.
Since the histogram is a type of plot, other properties of the plots can be set before or after the histogram is created.
The Default Properties (line thickness and color) may be configured using the Image Plot Properties.
The Series Properties (line thickness and color) can be changed after the histogram is plotted using the Plot Series Properties.
Plotting Commands, Plot Windows, Plot Properties, Histogram Properties