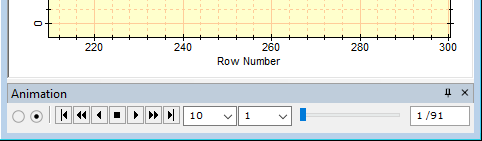
Plot Animation Bar
The Plot Animation Bar is a docking pane that switches between plot series displayed in a Plot Window. This works like the Animation Bar in an Image Window (see Adding Series to a Line Profile Plot). In addition, the Plot Animation Bar switched between Overplot mode, which overlays all plot buffers, and Animate mode, which shows each separate plot series. The mode (Overlay or Animate) is selected using either the two radio buttons at the left end of the Plot Animation Bar, or using the Plot Series Mode option in the Plot Context Menu. (see Plot Windows). On the Plot Animation Bar, the left-most radio button selects Overplot mode and disables the animation buttons. To switch to Animate mode, open the Animation Bar and select the right-most radio button.
This toolbar functions like the playback panel of media player software, with capabilities for forward and backward motion and other operations. The Plot Animation Bar is used to animate through the plot series or to simply change the currently active plot (i.e., the visible one on the top of the "stack"). You can change display Properties during image animation—for example to magnify or re-center the plot, or to move the mouse cursor to view the plot coordinates during animation.
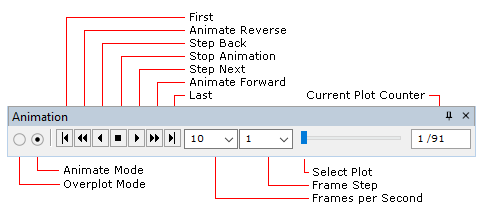
The Plot Animation Bar always opens along the bottom border of a window. It is not visible if the window contains only one plot. The trackbar on the right side of the toolbar uses tick marks to indicate the number of plot series—up to a point, after which only every n-th member is indicated). For example, the toolbar pictured here shows that there are 4 plot series in the window.
|
Tip |
You can change the speed or frame step during animation using the up/down arrows. However, if you type values into these fields while animation is running, they will not take effect until the next time you start animation.. |