Plot Properties
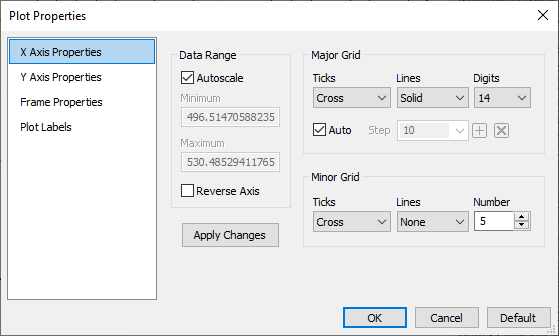
The Plot Properties dialog allows you to change the appearance of the plot. On the various pages of the dialog you can change the axis scaling, the tick marks, labels, fonts, colors, and more.
Open the Plot Properties dialog using the Plot window menu command View > Plot Properties... or right click on the plot and select the command from the menu.
X Axis Properties configures the X axis extent, major and minor ticks.
Y Axis Properties configures the Y axis extent, major and minor ticks.
Frame Properties configures the appearance of the plot frame, including fonts, colors, and lines.
Plot Labels configures the plot labels and captions.
|
Buttons on the Plot Properties Dialog |
|
|
[OK] |
Apply all changes and close the dialog. |
|
[Cancel] |
Discard changes and close the dialog. |
|
[Default] |
Apply all changes to future Plot Windows. |