Plot Bar
The Plot Bar is a docking pane "toolbar"
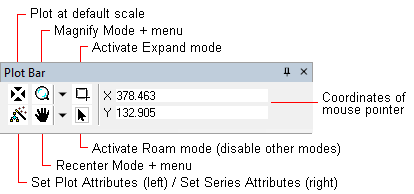
that provides frequently used commands for adjusting the appearance
of plot data. It also displays the coordinates of the mouse pointer
moving over the plot. The Plot Bar can be opened or closed
using the ![]() button on the Docking Panes
Toolbar.
button on the Docking Panes
Toolbar.
Plot Bar controls are duplicated in the Cursor Mode submenu of the Plot Context Menu. This is handy if you do not want to lose your visual context looking at the plot or if you have the Plot Bar undocked or disabled. The controls on the Plot Bar are described in the following table.
|
Plot Bar Buttons |
|
|
|
Re-plots the data at the default scale. The X and Y axes are autoscaled to fit all the data within the plot space. |
|
|
Enables Magnify mode, which magnifies up and down by dragging the mouse at a point. The range is 1/10x to 10x in both axes. To magnify the image:
Using the Drop MenuThe drop arrow opens a menu with 3 constrained magnify commands. These commands magnify in 1/2x and 2x steps horizontally, vertically, or in both directions. To use these buttons,
|
|
|
Activates Expand Mode. In this mode you rubber-band a rectangle around a region of data you wish to enlarge. Disable Expand Mode by clicking the Roam button. |
|
|
Changes the plot appearance. It has two functions:
|
|
|
Enables Centering mode, which shifts the plot data within the plot box. Use this to re-position the data or bring different data into view. To re-center the image:
Using the Drop MenuThe drop arrow opens a menu with 2 constrained re-centering commands for shifting the plot horizontally or vertically.
|
|
|
Activates Roam Mode. This disables all command modes for the Plot Window, including modes of other toolbars. |
Plot Windows, Plotting Images and Data, Docking Panes Toolbar