Working with Report Windows
Each Report Window provides some functionality to adjust its contents for display purposes. You can sort the rows by any column and you can reorder the columns so that certain quantities become adjacent to each other. These adjustments can be combined with the copy, save, or print commands to select particular data from the table.
|
Operation: |
Procedure: |
|
Resize a Column |
Mouse down on the column separator and drag the separator to the desired width. Release the mouse at the final position. |
|
Optimize Column Widths |
Click the Optimize Columns command in the Report > View menu. The Report Window must have focus in order for this menu to be loaded. To set default behavior, check the View > Auto-optimize Columns command or the Optimize Widths box on the Report Window Preferences page. |
|
Sort Row Data |
Click on the column header to to perform the sort. A sorting triangle then appears inside the column label. Click again to reverse the sort order. |
|
Reorder Columns |
Mouse down on the column header away from the separator. Drag the mouse pointer outside the cell and the left column separator will appear in bold. Drag the separator to the insertion point and release the mouse. The column of data will move to the insertion point. |
|
Edit Data |
Click on the cell you wish to edit and the cell will highlight to show that edit mode is enabled. After changing the text, save your changes by either clicking outside the cell or moving outside the cell using the keyboard arrow keys. |
Here we show how to adjust the Statistics Measurements using the procedures described above. The functionality shown here is built into all Report Windows.
In this example, we will show the effect of a
cosmic ray event on the statistics in that part of the image.
First, an Image Set
consisting of 4 of sample images was opened into an
Image Window. Then
the Image Cursor was
positioned around the cosmic ray event and was adjusted to enclose
a small rectangle around it. To measure the entire image
set, the ![]() button was pressed
on the Image Window. Then the
button was pressed
on the Image Window. Then the ![]() button
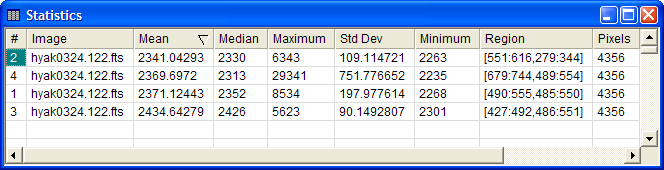
was clicked to compute the statistics. The following table resulted
from the measurement.
button
was clicked to compute the statistics. The following table resulted
from the measurement.
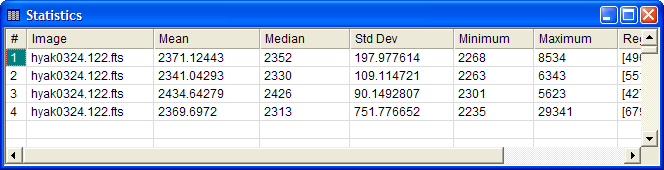
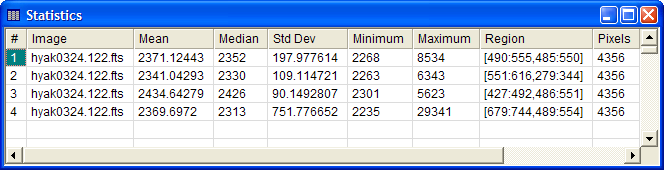
In the figure above you can see that the results for measuring 4 images. The table data are wider than the visible window. We could see the columns beyond the right border by residing or scrolling the table. We could click on the column separator lines and drag each column to a narrow width, but there is a better way in this situation: Use the Optimize Columns command in the View menu. This command shrinks all column widths to the minimum size that still shows all information. The result shows all columns within the original table width. If not, we could have left it alone or enlarged the window simply by pulling the edge or corner. Reports may be automatically optimized by checking the Auto-optimize Columns setting in the Report's View menu or the Optimize Columns setting on the Report Window Preferences page.
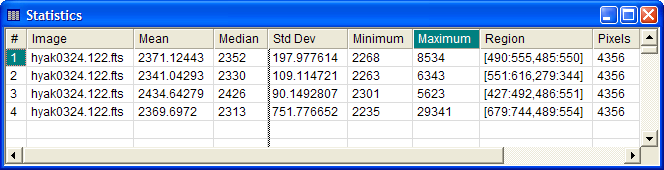
Next, we want to examine if the bright cosmic ray detection would reveal itself in the average value inside the region. This requires comparing the Maximum value (which shows the bright point) with the Mean and Median values. To make it easy, the Maximum column was moved to beside the Median, which puts the 3 numbers of interest together. The next picture shows the effect of mouse down on the column header for the Maximum value. With the mouse button down, the column turns the cell selection color when the mouse moves outside the column. This tells you that a move is active. Notice also the vertical separator bar tracking the mouse—this shows where the left column margin is going to be placed when you release the mouse button.
After releasing the mouse button, the table is reordered as follows:
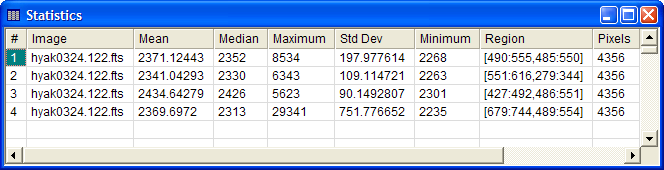
Next, we will sort the row order by increasing Mean value by clicking on the column header (a sort triangle appears next to the "Mean" column label). This shows that the highest maximum value, caused by the cosmic ray event, corresponds to the image having the lowest Median and Minimum values.
The table in the reordered state as shown above is ready to accept new measurements in the new column order.
To put the rows back into their original measurement order, click the # column on the left. This column always lists the sequential order of measurement.