Mark Statistic
The Mark Statistic command draws in the
Plot Window a
statistic selected from the Statistics Measurements window. Statistics are
computed for the plot window using the button on the main Image Measurements
Toolbar, the Measure >
Statistics command in the pull-down menus or the ![]() button on the Plot Bar. The statistic to draw is selected from the
Statistics
Measurements window by right-clicking on the desired value and
then selecting Mark Statistic from the
pop-up menu. Various statistics may be measured according to the
settings in the Statistics Properties window.
button on the Plot Bar. The statistic to draw is selected from the
Statistics
Measurements window by right-clicking on the desired value and
then selecting Mark Statistic from the
pop-up menu. Various statistics may be measured according to the
settings in the Statistics Properties window.
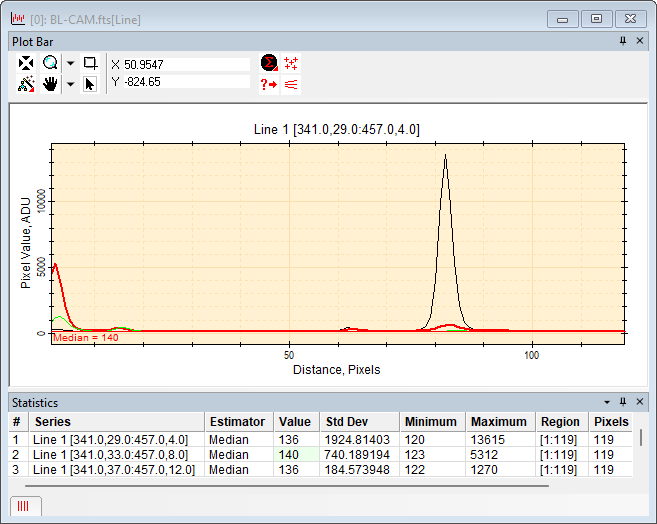
The illustration above was created using the Procedure, below. The different plot series are shown with different colors and thickness set before creating the plot using the Image Plot Properties dialog. They may be changed after creating the plot using the Plot Series Properties dialog.
This procedure uses the Line Profile command in an Image Window to create several plot series in a Plot Window. The median value is then computed for each of the plot series and one of the values is marked in the Plot Window:
Bring the target Image Window to the top of the window stack.
Open the Line Profile Toolbar using the button on the main toolbar or the Plot > Line Profile Toolbar command in the main menu
On the Line Profile Toolbar, select Marking mode and draw the first profile line on the image.
On the toolbar, enter Move mode. Grab the first profile line and move to a new location. Release the mouse at the new location.
Move the Line Profile line to a third location. This results in a total of 3 plot series appearing in the Plot Window.
Select a statistical estimator to compute for
all plot series: To select the target statistic, right-click
the ![]() button on the Plot Bar or use the the Measure > Statistics Properties submenu from the
Plot Window
pull-down menu. In the Statistics Properties dialog, select the estimator
and set its parameters as needed.
button on the Plot Bar or use the the Measure > Statistics Properties submenu from the
Plot Window
pull-down menu. In the Statistics Properties dialog, select the estimator
and set its parameters as needed.
Click (left-click) the ![]() button on the Plot Bar to compute the estimator value for all plot
series. The Statistics pane will open (if not already open)
to list the results.
button on the Plot Bar to compute the estimator value for all plot
series. The Statistics pane will open (if not already open)
to list the results.
In the Statistics pane, right-click on the line containing the estimator you want to draw in the Plot Window. In this example, the median estimator with value 140 was selected from line 2. The cell that was clicked is highlighted in green. Right-clicking opens the popup menu for the Grid Control.
From the popup menu, select Mark Statistic. The estimator name and value are marked on the plot with a line indicating the value.
To compute a different statistic or to mark a different one on the plot, repeat steps 7 through 9. Each marked statistic replaces the one currently drawn.
To delete the marked statistic, open the Plot Line Measurements toolbar and select the Delete action.
Mira Pro x64 User's Guide, Copyright Ⓒ 2023 Mirametrics, Inc. All
Rights Reserved.