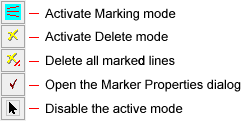
Plot Line Measurements
The Plot Line Measurements tool marks lines in a Plot Window. Although the lines may be drawn at any angle to get the starting and ending coordinates, perhaps the most interesting application is drawing with the SHIFT key to assure that only a perfectly horizontal or vertical line is drawn parallel to the x-axis or y-axis.
The commands in the line plotting package originate
in a docking pane toolbar that may be opened, closed, and tabified.
The plot series and line coordinates are accrued in the
Lines grid pane for the plot window. The toolbar opens with
Marking Mode active. Marker properties are set in the
Marker
Properties dialog opened from the ![]() button on
the toolbar. To disable the active marking mode, use the arrow
button at the bottom of the pane.
button on
the toolbar. To disable the active marking mode, use the arrow
button at the bottom of the pane.
To activate the Line Measurements
toolbar, click ![]() on the Image Measurements
Toolbar or the Plot
Bar, or use the command in the pull-down main menu for Plot
Windows.
on the Image Measurements
Toolbar or the Plot
Bar, or use the command in the pull-down main menu for Plot
Windows.
The following picture shows a Plot Window with a line marking the (x,y) coordinates of two peaks. Measurement results accrue in the Lines Docking Pane which opens at the bottom of the window.
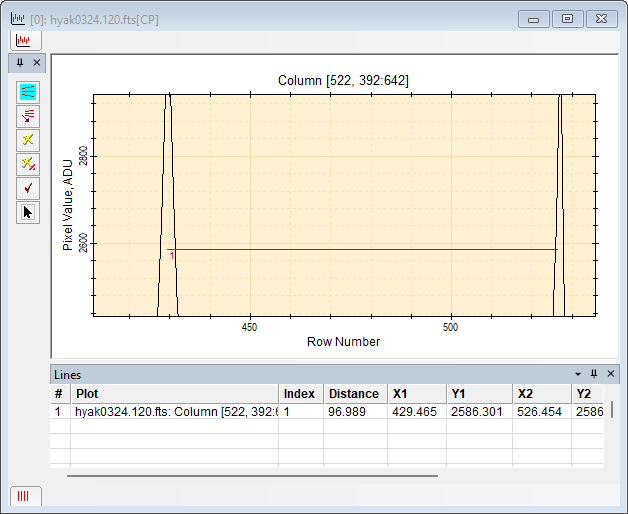
The line drawn in the picture above created a Lines measurements pane and added the measurement to it. The SHIFT key was held during measurement to assure that the line was drawn completely horizontal to measure the true distance along the x axis.
|
Tip |
To draw a line only along multiples of 90 degrees (horizontal or vertical), press the SHIFT key and hold it before starting to draw. Do not release the SHIFT key until after releasing the mouse button at the end of the line. |
Adjust the plot to the desired scale, showing the region to measure.
Click the ![]() button on the Image Plot Toolbar or use the Plot > Line Profile Toolbar menu command to open
the toolbar. Marking mode is automatically enabled when the toolbar
is first opened. To reactivate it, click
button on the Image Plot Toolbar or use the Plot > Line Profile Toolbar menu command to open
the toolbar. Marking mode is automatically enabled when the toolbar
is first opened. To reactivate it, click ![]() at the top of the Plot Lines Toolbar.
at the top of the Plot Lines Toolbar.
Move the mouse to the starting point. Press and hold down the left mouse button.
To draw a line only in multiples of 90 degrees, press the SHIFT key and hold it before starting to draw. Do not release the SHIFT key until after releasing the mouse button at the end of the line.
With the left button down, drag the mouse pointer to the endpoint and release the button. The results are reported in the Lines docking pane of the Plot Window.
To measure other lines, repeat steps 3 and 4.
When finished drawing lines, you can disable
marking mode by clicking ![]() on the toolbar.
on the toolbar.
The line data are tabulated in the Lines grid like the one shown above. This is a Docking Pane that attaches initially to the bottom border of the Plot Window but may be moved, tabified, and so on. The results listed in the grid may be sorted, rearranged, saved to the clipboard or a file, and so on. The items in this report are described below.
Line Measurements
|
# |
The sequence number of the line in its series. |
|
Plot |
The title of the plot. |
|
Index |
The sequence number of the line measurement |
|
Distance |
The distance between the beginning and ending points. |
|
X1 |
The X coordinate of the starting point. |
|
Y1 |
The Y coordinate of the starting point. |
|
X2 |
The X coordinate of the ending point. |
|
Y2 |
The Y coordinate of the ending point. |
|
Notes |
Space to add comments about the measurements. These will be included if you export the table to a text file. |
Mira Pro x64 User's Guide, Copyright Ⓒ 2023 Mirametrics, Inc. All
Rights Reserved.