![]() Line Profile
Line Profile
A Line Profile is a graph of pixel values versus distance along a line drawn on the image. A Line Profile differs from a Column Profile Plot and a Row Profile Plot in that the sample line is drawn manually using the mouse, In addition, the Line Profile plots intensity versus distance on the x axis, whereas a column or row profile plots intensity versus position. To change the line ("marker") this command draws on the image, see Marker Properties. See Creating a Line Profile for details about the line profile plotting procedure.
Below is shown the Line Profile Toolbar,
which is a docking pane that controls most of the line profile
plotting functions. Note: Additional options are available from the
drop menu of the Line Profile button ![]() on the main Image Plot Toolbar. These are described in the
topic Creating a Line Profile.
on the main Image Plot Toolbar. These are described in the
topic Creating a Line Profile.
Additional properties may be set using the Line
Profile drop menu described below. above adds options to those on
the Line Profile Toolbar. It opens from the ![]() button on the main Image Plots
Toolbar.
button on the main Image Plots
Toolbar.
|
TIP: |
To draw a line only in multiples of 45 degrees, press the SHIFT key and hold it before starting to draw. Do not release the SHIFT key until after releasing the mouse button at the end of the line |
The Line Profile is drawn into a Plot Window like that shown below. Notice that the horizontal axis is distance, not an absolute position as used in Column Profile and Row Profile plots. The Plot Window below shows multiple parallel profiles on the head of a comet. These were made by switching to toolbar Move mode and repeatedly dropping the profile line further along the long axis of the comet head. The spike was caused by the profile line crossing a star.
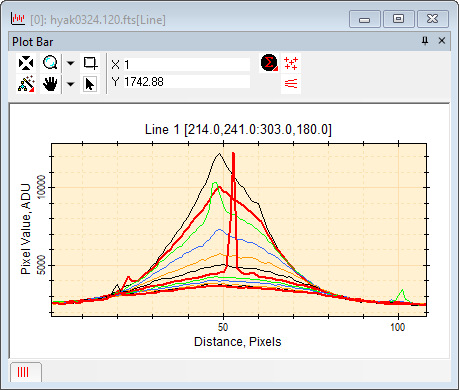
Multiple line profile plots may be over-plotted onto an existing line profile plot after the drawing line is repositioned at different image locations. For example, you may wish to plot several parallel line vectors near the same point. Two methods are available for moving the plot line relative to the first point:
A perpendicular move allows the marker to move
only in a perpendicular direction so that additional line profiles
are made parallel to the original one. To select this, check the
Move Perpendicular command (shown
below) in the drop menu of the Line Profile button ![]() on the main Image Plots Toolbar.
on the main Image Plots Toolbar.
An unconstrained move allows the marker to move anywhere on the image. To select this, un-check the Move Perpendicular command in the drop menu of the Line Profile button on the main Image Plots Toolbar.
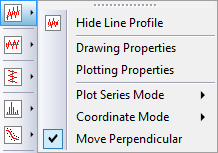
Since the Move Perpendicular option applies to adding lines to an existing profile plot, it is grayed out until the first line is drawn and the toolbar is switched to Move mode. The Hide Line Profile command appears because this drop menu was opened while the Line Profile Toolbar was open. If the toolbar is not open, the first command isLine Profile Toolbar, which opens the toolbar.
Adjust the image to the desired scale, showing the region to measure.
Click the ![]() button
on the Image Plot
Toolbar or use the Plot > Line Profile
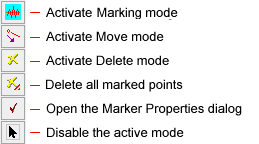
Toolbar menu command to open the toolbar. Marking mode is
automatically enabled when the toolbar is first opened. To
reactivate Marking Mode it, click
button
on the Image Plot
Toolbar or use the Plot > Line Profile
Toolbar menu command to open the toolbar. Marking mode is
automatically enabled when the toolbar is first opened. To
reactivate Marking Mode it, click ![]() at the top of the toolbar.
at the top of the toolbar.
Move the mouse to the starting point. Press and hold down the left mouse button.
To draw a line only in multiples of 45 degrees, press the SHIFT key and hold it before starting to draw. Do not release the SHIFT key until after releasing the mouse button at the end of the line.
If Centroid First Point is checked in the Marker Properties dialog, the position will lock onto the local centroid near where the mouse is released.
With the left button down, drag the mouse pointer to the endpoint and release the button.
If Centroid Last Point is checked in the Marker Properties dialog, the position will lock onto the local centroid near where the mouse is released.
The results are displayed in a Plot Window. If using Move mode, the new lines are drawn in the same Plot Window as as the first line.
To create other profile plots, repeat steps 3 and 4.
When finished drawing profile lines, you can
disable marking mode by clicking ![]() on the
toolbar.
on the
toolbar.
Adding Series to a Line Profile Plot
Mira Pro x64 User's Guide, Copyright Ⓒ 2023 Mirametrics, Inc. All
Rights Reserved.