![]() Plot Point Query
Plot Point Query
The Plot Point Query tool retrieves
information points graphed in a Plot Window. The tool tabulates the plot series and
point index plus the X and Y coordinates for the selected data
points. The point markers accrue on the plot until you close the
toolbar. Results are reported in the Points Pane which
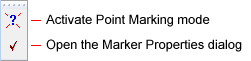
attaches to the Plot Window. The toolbar opens with Marking Mode
active. Marker properties are set in the Marker Properties
dialog opened from the ![]() button on the toolbar.
button on the toolbar.
To activate the Point Query toolbar,
click ![]() on the Image Measurements Toolbar or use the Measure >
Points command on the main menu.
on the Image Measurements Toolbar or use the Measure >
Points command on the main menu.
The following picture shows a Plot Window with several points marked on the graph. Results accrue in the Points Pane which is tabified at the bottom of the window in this view.
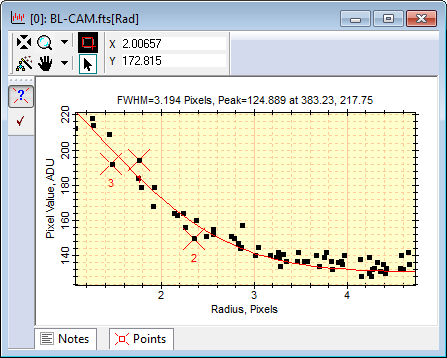
The 3 points marked above created a Points pane and added the measurements to it. You also could open and pin the pane to the window border to see measurements accrue as they are marked.
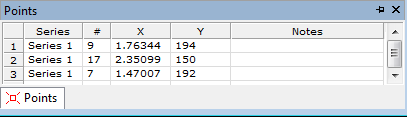
The point query results are tabulated in the Points grid like the one shown above. This is a Docking Pane that attaches initially to the bottom border of the Plot Window but may be moved, tabified, and so on. The results listed in the grid may be sorted, rearranged, saved to the clipboard or a file, and so on.
The items in the Report are described in the table below.
Point Query Results
|
Series |
The plot series, starting with series 1. |
|
# |
The sequence number of the point in its series. |
|
X |
The X coordinate of the point. |
|
Y |
The Y coordinate of the point. |
Plot Windows, Plotting Commands, Plot Notes Pane, Docking Panes, Grid Controls