![]() Creating
a Line Profile Plot
Creating
a Line Profile Plot
A Line Profile Plot is made by drawing a line on a displayed image. There are a number of options that determine how the plot will be made. Options include using world coordinates and centroiding on the endpoints. The following is an example of a line profile plot:
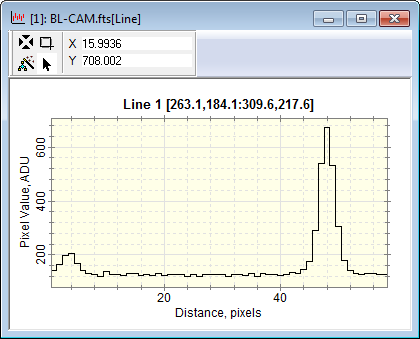
Notice that the plot X AXIS shows distance rather than coordinates. The line plot is generally drawn at an angle, so it has no attachment to either column or row coordinates.
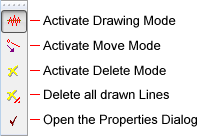
This command can be operated from a Window Toolbar
or from a Menu extending from the ![]() button on the Image Plot Toolbar.
button on the Image Plot Toolbar.
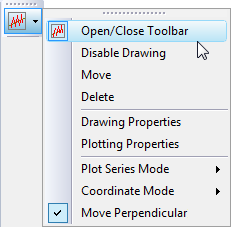
The menu offers more specialized commands than the Line Profile toolbar:
Make sure the target Image Window has focus. Adjust image magnification and position so you can see the region you want to plot.
Enable Line Profile Mode using one of these methods:
If the Line Profile Toolbar is open, click ![]() .
.
On the Image Plot Toolbar, click ![]() .
.
On the Image Context menu, select Plot > Line Profile.
Move the Mouse Cursor to the first image point and click mouse down.
Drag the rubber band line to the final image point and release the mouse button.
The Line Profile Plot appears in a new Plot Window.