The Palette Graph
In the Palette Properties dialog, the Palette Graph shows the relationship between the image luminance (brightness) and the color you see on the screen. For non RGB images, the image brightness range is sliced into 256 bins by the Transfer Function. Each bin of brightness has a lower and upper bound and the palette is a table of colors assigned to each small range of brightness spanned by each bin. By changing the actual color value assigned to an index of the transfer function, the all pixels assigned to that index will change on the displayed image. This provides a way to enhance and suppress image features in different regions of the brightness scale. Note that palette or transfer function changes do not affect the actual pixel values in the image—they are just display adjustments.
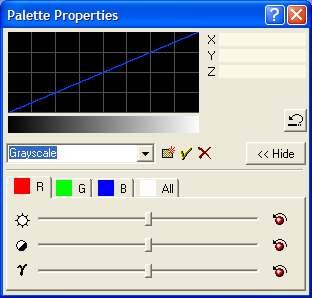
The Palette Properties dialog (see below) displays a plot called the Palette Graph, which plot the color intensity versus image brightness level for each of the 3 color channels. When you roam the mouse pointer over the Palette Graph, the coordinates of the pointer in "palette space" are displayed in 3 fields to the right of the graph.
To the right of the palette graph, the following quantities are listed for the position of the mouse pointer:
The X field lists the x-coordinate of the pointer. This is the transfer function index and it ranges from 0 to 255 for a total of 256 levels.
The Y field lists the y coordinate of the mouse pointer. This is the color intensity in the selected channel and it ranges from 0 to 255 units of color. The active channel is selected using the tabs in the lower portion of the dialog (not shown in the above figure).
The Z field is the actual image luminance, or pixel value, at the midpoint of the range of brightness assigned to the palette color.
Using the 3 definitions above, we can decipher what is shown in the sample window above. The pointer is at coordinate (70,206) which corresponds to index 70 of the palette. Index 70 is assigned a red value of 206 in the range 0 (black) to 255 (maximum red). The Z value of 2424 indicates that a pixel value of 2424 is at the midpoint of palette index 70. Palette Index 69 might correspond to an average pixel value of 2410 and index 71 to an average pixel value of 2438.
What happens to pixel values below palette index 0 or above palette index 255? All image values below palette index 0 are assigned the color of palette index 0 and all of those above index 255 are assigned the color of index 255.