Bit Histogram Plot
The Bit Histogram command plots a histogram of the frequency of bit values in the digital image, as sampled inside the image cursor. The histogram frequency measures the occurrence of each power of 2 in the values of the pixels, as measured in digital counts (e.g., Analog to Digital Units, ADU, or Digital Number, DN). This type of plot is helpful for assessing whether the camera's A/D Converter is performing correctly and whether it is limited by random noise or favors certain bits.
Create the Bit Histogram plot using the Measure > Diagnostics > Bit Histogram command. or use the drop-button menu beside the Histogram button on the main toolbar.
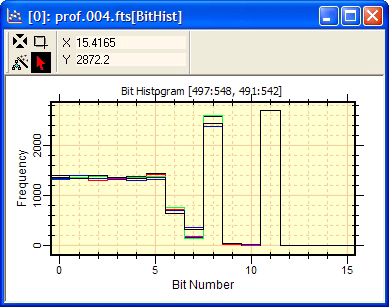
The example below shows the bit histogram of 5 images in an image set, with the Plot Window in Overlay mode.
|
|
|
In a digital image, pixel values are represented as binary numbers which are the sums of powers of 2. For example, a pixel value of 2 has a binary representation of 2 = 2 + 0 = (1*21) + (0*20). A bit histogram plot would represent a pixel with value "2" as adding 1 to the frequency of bit 1 and nothing to the frequency of any of the other bits. Similarly, a pixel value of 21 would be represented as follows: 21 = 16 + 4 + 1 = (1*24) +(1*22) + (0*20), and the bit histogram would show this as 1 add to the frequency in each of the bins at x = 4, 2, and 0. A pixel value of 16384, or 1*214, would add 1 to the frequency of bit 14 in the bit histogram.
The highest bit numbers in the histogram correspond to high count levels in the image. For example, in the plot above, bits 11, 7, and 6 are very frequent because the image has an offset (background level) of around 2280 ADU, which is slightly above the sum of the next lowest powers of 2 given by 2048 + 128 + 64, or (1*211) + (1*27) + (1*26). The most interesting bits are the lowest order bits, those with bit numbers 0, 1, 2, etc., since they are represent variations within the noise output by the camera's A/D converter. The lowest order bits help to answer the question of whether the A/D converter is limited by true random noise or whether it biases (favors) certain bits. The answer to this question assesses the level of precision that you can reach in measurements made from a particular image. In the ideal case, in which the noise is total randomized, the lowest bit numbers should be equally represented. Inside the image cursor, where the pixels were sampled to make the plot, this image has a standard deviation of 26 (ADU). The plot shows that bits 0 through 4 are more or less equally represented, which is what you would expect for random noise with a standard deviation of 26. In this example, you would conclude that the image shows very good noise performance by the camera.