|
|
Plot Point Data Pane The Point Data Pane is a docking pane that displays a single line of text with data for the current marker or line under the mouse pointer. Moving the mouse off a marker or line blanks out the pane. In comparison, the Plot Bar continously lists the (x,y) coordinates of the mouse pointer anywhere in the Plot Window. The Plot Point Data Pane can be helpful when the plotted data are generated by a script, since the script can tag the points with arbitrary data.
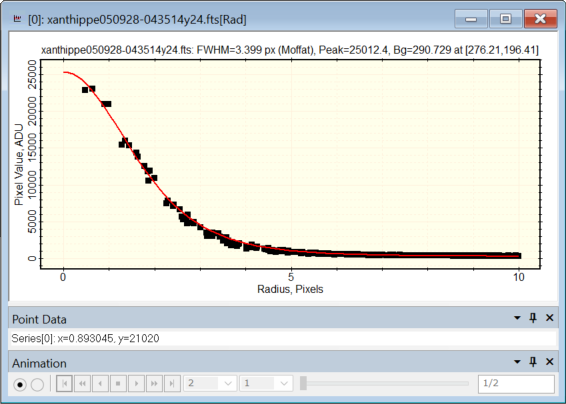
The picture below shows the default point data listed when the mouse was hovered over one of the square markers near the top left of the plot.
Properties Listed in the Point Data PaneThe data below are listed in a single line of text when the mouse hovers over a point with Query Point Data active:
Related Topics
Mira Pro x64 8.73 User's Guide, Copyright Ⓒ 2024 Mirametrics, Inc.
All Rights Reserved. |