![]() Radial Profile
Plot
Radial Profile
Plot
The Radial Profile Plot shows the intensity of all pixels surrounding a point. Mira calculates the Full Width at Half Maximum ("FWHM") by fitting a PSF + Constant model to the point data. The PSF (Point Spread Function) model may be selected as a Moffat or Gaussian function using the [Advanced] button in the Radial Profile Properties. Properties that control the fit and calculations are set using the Radial Profile Properties dialogs. Fit results are listed in the Main Message Pane of Mira's main window. The title bar of the radial profile plot window consists of the image title and a [Rad] suffix referring to the [Rad]ial profile plot.
Move the center of the Image Cursor to the center of the point source. If using the Auto Centroid option in the Radial Profile Properties, you need only to move the Image Cursor to within 1 to a few pixels of the true center. If the Image Window is not in "Cursor" mode, you can jump the cursor to the target position by holding down [Shift] while clicking on the target.
Use the Plot > Radial
Profile menu command or click the ![]() button. This command is also operated using the 'r' (or
'R') keystroke
command when the mouse pointer is hovering over the target
Image Window.
Remember that the mouse position has no effect on the object
measured because the measurement uses the coordinates of the
Image Cursor.
button. This command is also operated using the 'r' (or
'R') keystroke
command when the mouse pointer is hovering over the target
Image Window.
Remember that the mouse position has no effect on the object
measured because the measurement uses the coordinates of the
Image Cursor.
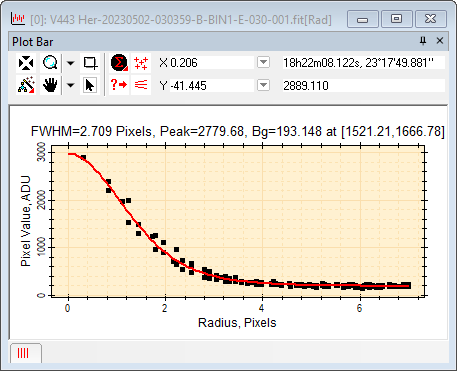
The radial profile plot below includes features in the new Plot Bar released in Mira version 8.62. The X and Y fields refer to the (x,y) data coordinates of the roaming mouse pointer inside the plot window. To the right, the two fields show world coordinates and pixel value referred back to the image. These image coordinates do not change as the plot pointer is roamed around the window because they refer to the centroid position and pixel value of the point source, both of which are constant in the source image.
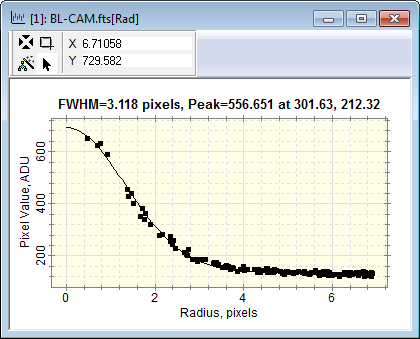
The two examples below compare the FWHM measured on a bright point source and faint point source in the same image. Notice that these plots were made using an older version of Mira that provides a less capable Plot Bar than shown in the figure above; however, the radial profile functionality is the same. The first plot uses a bright source, and the FWHM is determined with high precision.
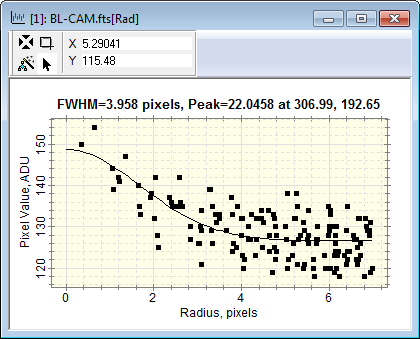
The plot below was made from an extremely weak source. The FWHM is calculated to be larger than for the bright source, reflecting far greater uncertainties in the fit parameters in the presence of extreme noise. Notice that the star profile contributes only a small bump to the background noise.
The fitting properties are configured using the Radial Profile Properties dialog.Advanced properties such as the PSF model are set in the PSF Fit Properties dialog opened from the [Advanced...] button.
If the source image has a WCS calibration, the Radial Profile can be plotted with radius in pixel units, linear distance units, or angular units on the horizontal axis. Otherwise the plot is made using pixels as the unit of radius.
After computing the FWHM value, Mira saves the value in pixel units into the image header using the PSF-FWHM keyword. If the image has a WCS calibration, the FWHM is saved in world coordinate units using the WCS-FWHM keyword.
Mira Pro x64 User's Guide, Copyright Ⓒ 2023 Mirametrics, Inc. All
Rights Reserved.