Tutorial: Using FITS Keywords to Analyze Image Data
The Mira User Interface provides powerful tools to analyze image properties using quantities stored in FITS header keywords. This tutorial shows how to combine some of the user interface tools to accomplish some high-level data analysis. Of course, nearly any kind of analysis may be accomplished using a script. For example, you may wish to evaluate the stability in the sky transparency by graphing the sky (background) brightness versus time for a series of images. Doing this requires a series of images spanning the time of interest plus calculation of two quantities: the background brightness and some measure of time. Both of these quantities are calculated for each image and saved to their FITS headers. These data are then extracted from the headers and graphed. This tutorial covers the procedure to produce such a graph via user interface commands and also provides an equivalent script.
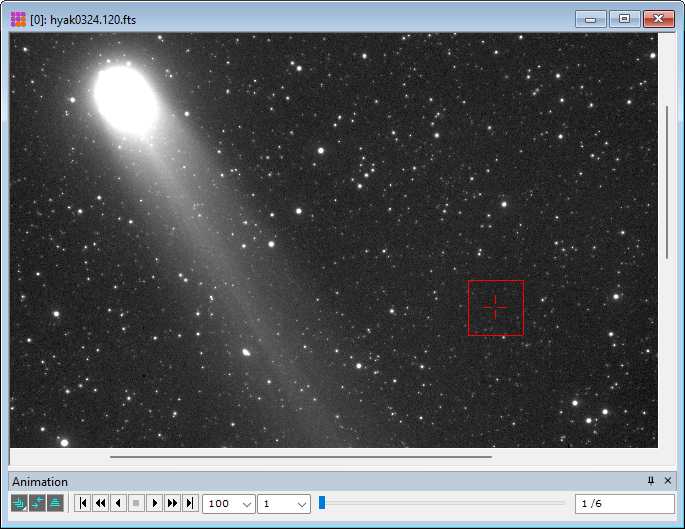
1. Open a set of "science" (not calibration) images spanning the time period of interest. Select the "Hyakutake*.fts" images from the "<Documents>/Mira Pro x64 Data/Sample Images" folder images and open them as an Image Set in a single Image Window as shown below. Move the Image Cursor off the image center onto an area of sky. Since we will be using the sigma-clipped mean estimator, the cursor does not have to be devoid of stars.
2. For the time value (X Axis), ensure that the Julian Date exists in each image header.
If Julian Date already exists in all image headers, skip to the next section regarding the brightness estimator.
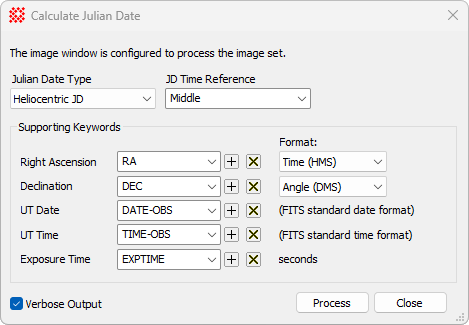
If Julian Date is not present, use the DATE-OBS keyword to calculate it using the menu command Process > Utilities > Calculate Julian Date to calculate it from DATE-OBS. The Julian Date will be stored in all image headers. If adding the Julian Date to the images, MJD is recommended because it gives the shortest number. The picture below shows the Heliocentric Julian Date ("HJD") selected. If using JD or MJD, the Right Ascension and Declination are not required from the image headers.
3. For the background brightness estimator (Y Axis), ensure that a background estimate exists in each image header.
As shown in Step 1, position the Image Cursor over a region to be sampled in all images.
Select the Image Set flag to Process the image set. Do this using the Image Set Properties dialog or the [P] button on the Image Bar.
With the Image Window on top, use the Statistics > Statistics Properties command to
open the Statistics Properties dialog. You may also execute
this command using the Properties
command from the drop menu of the ![]() button on the main Measurements Toolbar.
button on the main Measurements Toolbar.
From the statistical estimators, select Mean - Sigma Clipped, and set its parameters as desired. The default parameters 3, 3, 5 are fine for this purpose. Also checkSave Statistics to Header at the bottom left corner of the Statistics Properties dialog.
With the Image Window on top, compute the Mean - Sigma Clipped statistic for the
image set. There are 3 ways to do this: 1) Use the Measure > Statistics command from the Image Window menu, 2) click
the ![]() button on the main Measurements
Toolbar, or 3) use the 's' keystroke (see Image Window
Keystroke Commands).
button on the main Measurements
Toolbar, or 3) use the 's' keystroke (see Image Window
Keystroke Commands).
The statistics will appear in a grid window belonging to the Image Window.
4. Open the the Create Image Keyword List dialog using the File > Create Image Keyword List command.
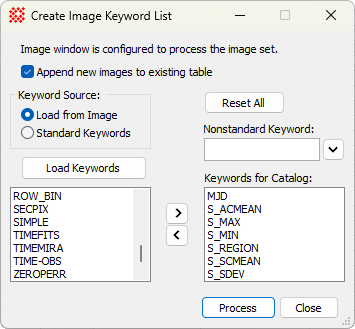
In the Create Image Keyword List dialog, selectLoad from Image and click [Load Keywords].
Scroll the left-hand list to find MJD (or another Julian Date value) and use [>] to move it to the right-hand list.
Scroll the left-hand list to find S_SCMEAN and move it to the right-hand list.
Scroll the left-hand list to find S_SDEV and move it to the right-hand list.
Also move any other keywords you wish to list in the catalog.
Click [Process] to create a Report Window containing a catalog of all keywords from the right-hand list.
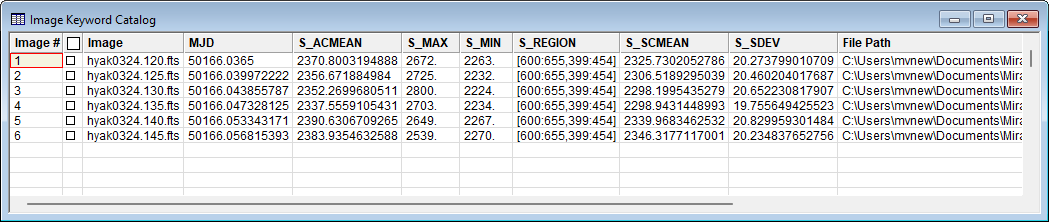
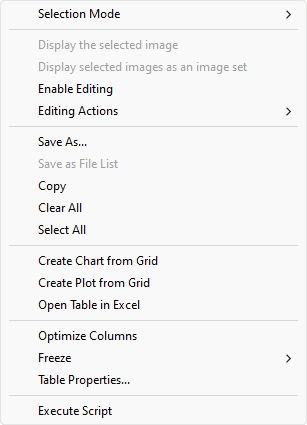
5. The Image Keyword Catalog opened in Step 4 appears below. Note the column headings.
Right click inside the Image Keyword Catalog to open its menu as shown below. Then select Create Plot from Grid from the menu.
6. The Create Plot from Grid command opens the dialog shown below. THis dialog will procude the scatter plot.
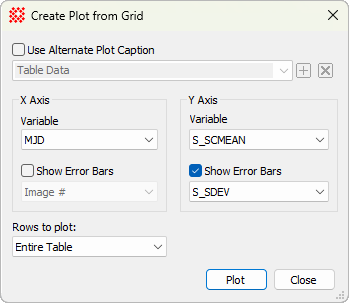
Select the variable MJD (or other Julian Date value) for the X Axis.
Select the variable S_SCMEAN (sigma-clipped mean) for the Y Axis.
For the Y Axis, check Show Error Bars and selectS_SDEC from the list.
In the Image Keyword Catalog window, right-click to open its menu. Select the plotting command you want to use: Create Chart from Grid or Create Plot from Grid. You might also wish to simply use Open Table in Excel and do further analysis there.
Select the grid columns to plot. In this example, the X-Axis variable will be JD and theY-Axis variable will be S_SCMEAN.
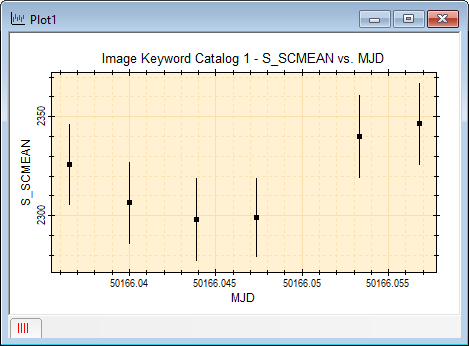
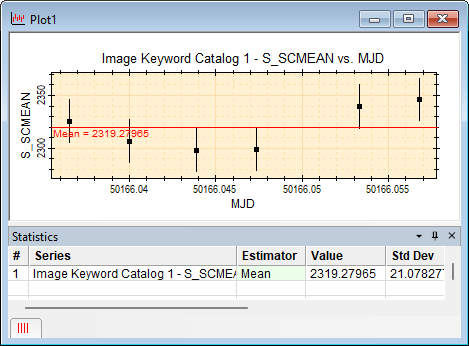
7. Click [Plot] to create the scatter plot of S_SCMEAN vsMJD with M_SDEV as the Y Axis error bars:
8. Compute the mean value of the 6 S_SCMEAN values and mark it on the plot:
With the Plot Window on top, use the Statistics > Statistics Properties command to
open the Statistics Properties dialog. You may also execute
this command using the Properties
command from the drop menu of the ![]() button on the main Measurements Toolbar.
button on the main Measurements Toolbar.
From the statistical estimators, select Mean.
With the Plot Window on top, compute the mean statistic for the plot series. This calculates the
average sky brightness for the 6 images in the plot series. There
are 3 ways to do this: 1) Use the Measure >
Statistics command from the Plot Window menu, 2) click the ![]() button on the main Measurements Toolbar, or 3) use the 's'
keystroke (see Plot Window Keystroke Commands).
button on the main Measurements Toolbar, or 3) use the 's'
keystroke (see Plot Window Keystroke Commands).
The statistics will appear in a grid window belonging to the Image Window.
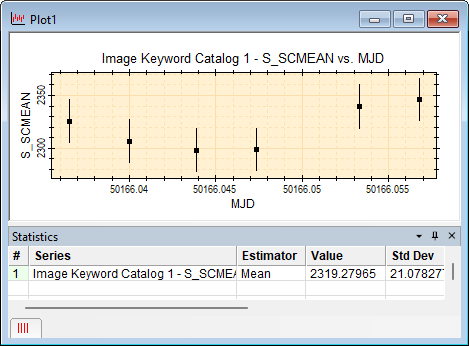
9. Mark the mean of the estimators for all 6 images on the plot:
In the Statistics pane at the bottom of the Plot Window, right-click on the line containing the estimator to draw in the Plot Window. This opens the grid popup menu.
In the popup menu, select Mark Statistic. The estimator name and value are marked on the plot with a line indicating the value.
A script can be written to perform the processing shown above, then launched from the Image Window displaying the Image Set. The script below, named "Image Statistics versus JD Plot.lua", is included in the "<Documents>\Mira Pro x64 Data\Sample Scripts" folder. Only 17 lines of code are needed to do the script's work, and the rest involves comments and "bullet proofing" to check the input data and trap errors. Following the script listing is a screenshot showing the resulting graph. The result is identical to the graph produced with the user interface procedure. Although this script does not save the 3 calculated quantities to the image headers, 3 more lines of code would be needed to do that.
-- /////////////////////////////////////////////////////
-- This script creates a scatter plot of mean sky brightness versus time for an image set.
-- Time (x-axis) uses the Modified Julian Date calculated from the UT date and time of the observation.
-- The mean sky brightness (y-axis) uses the sigma-clipped mean over a rectangle containing few stars.
-- When a script is executed from a Mira Image Window, two values are passed to the script:
-- 1) ParentImageView is a CImageView class object for the Image Window.
-- 2) ParentImage is a CImage class object for the current top-most image in the Image Window.
-- To run the script:
-- 1) Open an image set into an Image Window
-- 2) Right click on the image to open the menu and select "Execute Script"
-- 3) Navigate to the sample scripts and click [Open] to run the script.
-- ////////////////// Script processing starts here
-- Check that ParentImageView is a valid image window sent to the script:
if ParentImageView == nil or ParentImageView.class ~= "CImageView" then
Exit("The Image window is not valid\n")
end
-- Attach the CImageSet from the CImageView object
ImageSet = ParentImageView:GetImageSet()
if ImageSet == nil or ImageSet:Count() < 1 then
Exit("Cannot attach the window's image set\n")
end
-- Create 3 tables to hold values for x, y, and y error bars.
-- Since these are tables of numbers, a good habit is prefixing their names with "n"
nMJD = {}
nMean = {}
nSdev = {}
-- Create a statistics object:
S = new_stats()
-- Create a rectangle object:
R = new_rect(600,655,400,455)
nDone = 0 -- counter for the number of images processed
-- Loop over the images. The value of ImageSet:Count() is the number of images
for n = 1, ImageSet:Count() do
-- Get the next image from the image set
I = ImageSet:GetImage(n) -- returns a CImage object
if I == nil then
Printf("Image [%d] is invalid\n", n)
goto NEXT_IMAGE
end
-- Get the value of the DATE-OBS keyword from the image header
strDate = I:DateStr("DATE-OBS")
if strDate == nil then
Printf("DATE-OBS keyword not in '%s'\n", I:Path())
goto NEXT_IMAGE
end
-- Get the value of the TIME-OBS keyword from the image header
strTime = I:TimeStr("TIME-OBS")
if strTime == nil then
Printf("TIME-OBS (=DATE-OBS) keyword not in '%s'\n", I:Path())
goto NEXT_IMAGE
end
-- After passing the keyword tests, list the image in a text window.
-- List the full path abbreviated to no more than 60 characters
Printf("Adding image '%s'\n", I:Path(60))
-- Calculate the Julian Date the strDate and strTime strings
nJD = CalcJD( strDate, strTime )
-- Convert JD to MJD to reduce the length of x axis labels
nMJD[nDone] = CalcMJD(nJD)
-- Increment the counter for images processed
nDone = nDone + 1
-- Calculate the mean and standard deviation and save to nMean and nSdev
nMean[nDone], nSdev[nDone] = S:SigmaClipMeanSdev(I,3,3,5,R)
::NEXT_IMAGE::
end
-- Make a scatter plot from the 3 tables:
-- x axis = nMean
-- x axis error bars: there are none, so enter nil in their place
-- y axis = nMJD
-- y axis error bars = +/- nSdev
-- Use "MJD" and "S_SCMEAN" as the x-axis and y-axis labels
-- Note: only the first two parameters are required to create a plot
scattererr( nMJD, nMean, nil, nSdev, "MJD", "S_SCMEAN", "Scatter plot of S_SCMEAN vs MJD")
-- end of the script

Here is the basic script without comment lines or error checking:
ImageSet = ParentImageView:GetImageSet() -- get the image set from the image window
nMJD = {}
nMean = {}
nSdev = {}
S = new_stats() -- Create a statistics object
R = new_rect(600,655,400,455) -- Create a rectangle object
nDone = 0 -- counter for the number of images processed
for n = 1, ImageSet:Count() do -- Loop over the images.
I = ImageSet:GetImage(n) -- returns a CImage object
strDate = I:DateStr("DATE-OBS") -- get the date string
strTime = I:TimeStr("TIME-OBS") -- get the time string
nJD = CalcJD( strDate, strTime ) -- calculate the Julian Date
nMJD[nDone] = CalcMJD(nJD) -- convert to Modified Julian Date
nDone = nDone + 1 -- increment the counter
nMean[nDone], nSdev[nDone] = S:SigmaClipMeanSdev(I,3,3,5,R) -- calculate mean and sdev
end
scattererr( nMJD, nMean, nil, nSdev, "MJD", "S_SCMEAN", "Scatter plot of S_SCMEAN vs MJD")
Mira Pro x64 User's Guide, Copyright Ⓒ 2023 Mirametrics, Inc. All
Rights Reserved.