![]() Region
Measurements
Region
Measurements
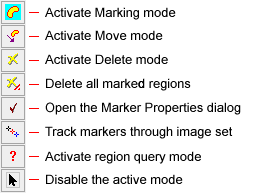
The Region Measurement tool measures the area, perimeter, and statistics inside a region drawn on an image. The region may be a rectangle, irregular polygon, or a free-hand drawn outline. Vertices of the region are marked using the mouse pointer. Regions drawn on the image are persistent until you leave Regions mode by closing the toolbar. Results are reported in the Regions Measurement Pane or Region Measurements report window. The toolbar opens with Marking Mode (top button) active. Regions may also be measured using the CMeasureRegions class in the Pro Script Module. See the Mira Pro x64 Script User's Guide.
To activate the Region Measurement tool,
click ![]() on the
Image
Measurements Toolbar or click Regions in the Measure
menu.
on the
Image
Measurements Toolbar or click Regions in the Measure
menu.
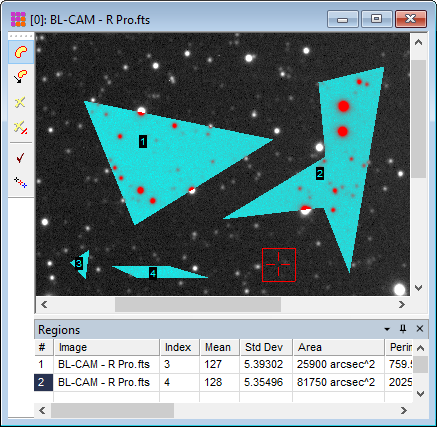
The picture below shows several irregular polygon regions marked on an image. The measurement results may be directed to a measurement pane or report window, as described below.
Three region types are available for marking regions. These are selected from a drop-down list in the Region Properties dialog.
|
Region Marking Modes |
|
|
Irregular Polygon |
The region is defined by a small number of connected line segments, each connected at a vertex. Regions are marked by clicking on vertex points. Several examples are shown in the picture above. |
|
Rectangular |
Each region is a rectangle of arbitrary shape. Regions are marked by rubber-banding from opposite corners. |
|
Free-hand |
The region outline appears as a continuous curve. |
Below are described procedures for drawing the 3 region types selected in the Region Properties dialog.
Drawing is initiated on a button press and terminated on the next button release at the opposite corner of the rectangle.
Adjust the image to the desired magnification, image position, palette, and other attributes.
Click the ![]() button on the Image Measurements Toolbar or use the Measure > Regions Toolbar menu command to open
the toolbar. Marking mode is automatically enabled when the toolbar
is opened. If marking mode has been disabled by prior commands,
activate it by clicking the
button on the Image Measurements Toolbar or use the Measure > Regions Toolbar menu command to open
the toolbar. Marking mode is automatically enabled when the toolbar
is opened. If marking mode has been disabled by prior commands,
activate it by clicking the ![]() button.
button.
Move the mouse to the starting point at the first corner. Press and hold the mouse button to begin marking.
With the mouse button down, drag the pointer to the opposite corner.
At the opposite corner, release the button to terminate the region. The results are reported in the measurement pane or window.
To measure other regions, repeat steps 3 though 5.
When finished you can disable marking mode by
clicking ![]() on the toolbar.
on the toolbar.
The following table lists the sequence of mouse clicks used for drawing a polygon. Generally, you must "mouse down" to start the first point, then drag to the second point where the mouse is released. Each additional point used in the sequence "Down + Up + Move". At the final point, double click to connect to the first point. This is outlined in the table below.
|
Point Index: |
Begin (1) |
2 |
3 |
4 |
... |
End (n) |
|
Mouse Action: |
Down + Move |
Up + Move |
Down + Up + Move |
Down + Up + Move |
Down + Up + Move |
Double Click |
Adjust the image to the desired magnification, image position, palette, and other attributes.
Click the ![]() button on the Image Measurements Toolbar or use the Measure > Regions Toolbar menu command to open
the toolbar. Marking mode is automatically enabled when the toolbar
is opened. If marking mode has been disabled by prior commands,
activate it by clicking the
button on the Image Measurements Toolbar or use the Measure > Regions Toolbar menu command to open
the toolbar. Marking mode is automatically enabled when the toolbar
is opened. If marking mode has been disabled by prior commands,
activate it by clicking the ![]() button.
button.
Move the mouse to the starting point. Press and hold the mouse button to mark the first vertex.
With the mouse button down, drag the mouse pointer to the second vertex and release the button.
With the mouse button up, move to each successive point (except the last) and then click the mouse button (down + up) to mark the vertex.
At the final point, double click the mouse to mark the last vertex and terminate the region. The results are reported in the measurement pane or window.
To measure other regions, repeat steps 4 though 6.
When finished you can disable marking mode by
clicking ![]() on the toolbar.
on the toolbar.
Drawing is initiated on a button press and terminated on the next button release.
Adjust the image to the desired magnification, image position, palette, and other attributes.
Click the ![]() button on the Image Measurements Toolbar or use the Measure > Regions Toolbar menu command to open
the toolbar (see on left Image Window margin, above). Marking mode
is automatically enabled when the toolbar is opened. If marking
mode has been disabled by prior commands, activate it by clicking
the
button on the Image Measurements Toolbar or use the Measure > Regions Toolbar menu command to open
the toolbar (see on left Image Window margin, above). Marking mode
is automatically enabled when the toolbar is opened. If marking
mode has been disabled by prior commands, activate it by clicking
the ![]() button.
button.
Move the mouse to the starting point. Press and hold the mouse button to begin marking.
With the mouse button down, drag the pointer around the region perimeter to its final point.
At the final point, release the button to terminate the region by connecting to the first point. The results are reported in the measurement pane or window.
To measure other regions, repeat steps 3 though 5.
When finished you can disable marking mode by
clicking ![]() on the toolbar.
on the toolbar.
Measurements are tabulated in either the Region Measurements measurement pane owned by the Image Window as shown above, or a Report Window as shown below. The difference between the two output options is that the Regions measurement pane receives only measurements of that Image Window whereas the Region Measurements window is global and receives measurements from all Image Windows.
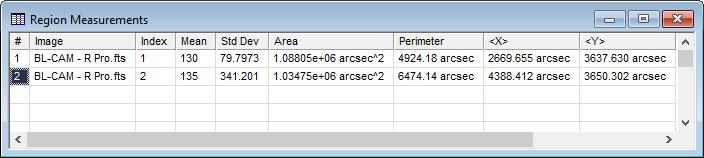
Column data in the Regions pane and Region Measurements report are described in the table below. The last few columns from the table below are not scrolled into view in the picture above.
|
Region Measurements Column Data |
|
|
# |
The sequence number of the measurement. |
|
Image |
The name of the image that was measured. |
|
Index |
The marker index for the particular image. |
|
Mean |
The mean pixel value inside the marked region. |
|
Std Dev |
The standard deviation of pixel values inside the marked region. |
|
Area |
The area of the marked region, measured in world coordinates. If the image has no world coordinate calibration, this equals the area in column and row coordinates. |
|
Perimeter |
The perimeter of the marked region, measured in world coordinates. If the image has no world coordinate calibration, this equals the perimeter in column and row coordinates. |
|
<X> |
The mean X coordinate of the region, measured in world coordinates. If the image has no world coordinate calibration, this equals the column coordinate. |
|
<Y> |
The mean Y coordinate of the region, measured in world coordinates. If the image has no world coordinate calibration, this equals the row coordinate. |
|
<Column> |
The mean Column coordinate of the region. |
|
<Row> |
The mean Row coordinate of the region. |
|
Notes |
Space to add comments about the measurements. These will be included if you export the table to a text file. |
Mira Pro x64 User's Guide, Copyright Ⓒ 2023 Mirametrics, Inc. All
Rights Reserved.