TGaussDev
The TGaussDev function creates a table (array) containing random numbers distributed according to a Gaussian probability density function. This function has two forms: 1) to create a Normal population with mean 0 and standard deviation 1, and 2) to create a Normal population with a specified mean and standard deviation.
table = TGaussDev( nCount )
table = TGaussDev( nCount, nMean, nStdDev )
where
![]() nCount is the number of Gaussian Deviates to
create.
nCount is the number of Gaussian Deviates to
create.
![]() nMean is an offset value.
nMean is an offset value.
![]() nStdDev is a scale factor.
nStdDev is a scale factor.
![]() table is the returned array containing
nCount values.
table is the returned array containing
nCount values.
One application in physics involves making the Gaussian approximation to a Poissonian distribution for shot noise, as in photon counting. In this case, dMean is the intensity and dStdDev is the 1-sigma noise equal to the square root of the mean.
The related GaussDev function returns a single Gaussian deviate as a number.
Since the same table is returned, this function may be used "inline" to modify the data. For example, you might use TSort(TGaussDev(t)) to create a table t of Gaussian random deviates sorted into ascending order.
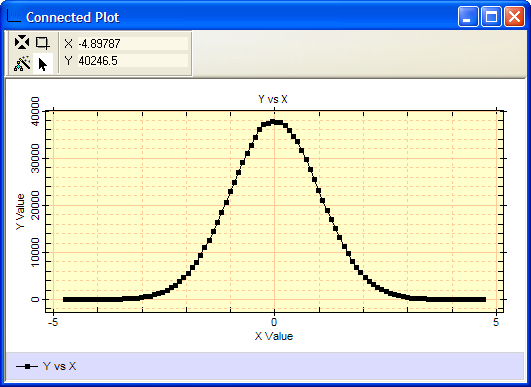
The following script creates 10,000 Gaussian random deviates having mean 0 and standard deviation 1 and plots them as a histogram. To make this script brief, the default histogram binning option, "Auto", is used. The auto option computes the minimum and maximum of the values created and selects the number of bins between, Since these values are not specified directly, the script must retrieve the histogram binning values actually used in order to make the plot.
|
|
-- create table of values |
|
|
-- create a Histogram object |
|
|
-- compute the histogram |
|
|
|
|
|
-- plot the histogram |
|
|
|
Below is the result of running this script. The PlotConnect function was called with default labels.

The following script creates n=1,000 values that mimic samples from a Poissonian distribution such as intensity measurements of photons. In such a distribution, the standard deviation equals the square root of the mean. This script uses a mean intensity of x=5,280, hence the math.sqrt(x) in line 3 of the script. The script is otherwise similar to the one above.
|
|
-- number of values |
|
|
-- mean value |
|
|
-- create table of values |
|
|
-- create a Histogram object |
|
|
-- compute the histogram |
|
|
|
|
|
-- plot the histogram |
|
|
|