PlotConnect
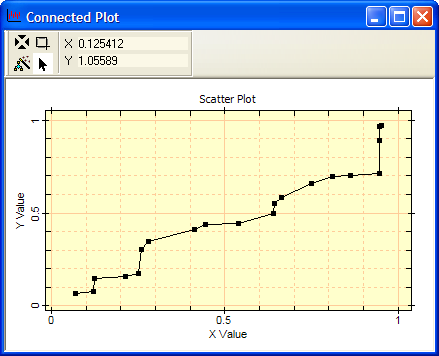
The PlotConnect function creates a marker plot with lines connecting the markers. The x and y data points come from separate arrays in which the x and y points at the same array index are presumed to define a point. This function also can plot x and y error bars. A comparison of the global plotting functions here.

Note: All parameters with * are optional and must be specified in the order shown.
P = PlotConnect( x, y, sCap*, sLabX*, sLabY*, xe*, ye* )
P = PlotConnect( OldPlotView, x, y, sCap*, sLabX*, sLabY*, xe*, ye* )
where
![]() Arguments
having * in their name are optional. If not specified, any missing
optional arguments revert to default values.
Arguments
having * in their name are optional. If not specified, any missing
optional arguments revert to default values.
![]() P is a new CPlotView
object attached to this plot
P is a new CPlotView
object attached to this plot
![]() x is a Lua table containing the x values.
x is a Lua table containing the x values.
![]() y is a Lua table containing the y values.
y is a Lua table containing the y values.
![]() sCap is an optional plot caption.
sCap is an optional plot caption.
![]() sLabX is an optional label for the x axis.
sLabX is an optional label for the x axis.
![]() sLabY is an optional label for the y axis.
sLabY is an optional label for the y axis.
![]() xe is an optional table containing the x error
bar values.
xe is an optional table containing the x error
bar values.
![]() ye is an optional table containing the y error
bar values.
ye is an optional table containing the y error
bar values.
![]() OldPlotView is an optional CPlotView
object that specifies an existing plot to which this new plot will
be added.
OldPlotView is an optional CPlotView
object that specifies an existing plot to which this new plot will
be added.
This function creates a quick, but finshed plot using just one line of code. The returned CPlotView object provides access to the plot for additional use by the script. For example, you can create multiple plot buffers having different plotting styles (scatter, connect, etc.) by passing the CPlotView returned by this function in the parameter list of a different plotting function. After the plot is created you also can use Mira GUI commands to change its properties such as the marker attribues, labels, and the general plot appearance; see Series Attributes and Plot Attributes in the Mira User's Guide.
Only the first 2 or 3 arguments, either (x,y) or (OldPlotView, x, y), need be provided to create the plot. If you want to use the other arguments, you must include a placeholder to fill any holes between Y and the first optional argument. For example, to plot x, y, and y error bars, but leave the other arguments at default values, use PlotConnect( X, Y, "Caption", 0, 0, 0, Ye ), where X, Y, and Ye are Lua tables.
For overplotted data, as when using the (OldPlotView, x, y, ...) form, the x axis label and y axis label is the same for all plot buffers. Therefore, you can set the x label and y label in just one of the function calls. Whenever you specify an x or y label, the label is applied to all plot buffers in the same CPlotView. Conversely, the sCaption argument should specify a new caption for each plot buffer unless you want to use Mira's default caption.
The script below creates some data from the random number generator and creates a scatter plot with default plot labels. Since none of the higher optional parameters is used, you can specify only the first two, x, and y.
|
|
-- 11 values between 100 and 110 |
|
|
-- 11 values between 20 and 40 |
|
|
-- create the connected line plot |
The following example creates a plot with error bars and labeled axes. Note that the default window caption is used by specifying the caption as "". No x error bars are to be used, so the entry is 0.
|
|
-- 10 values, 100 through 109 |
|
|
-- 10 values, 20 through 38 |
|
|
-- 10 Gaussian values in [-5,+5] |
|
|
-- create the connected plot |