Plot Averaging Modes
The Plot Averaging Mode describes how a range of adjacent rows or columns are combined to produce a plot showing a single line. Plot Averaging works only for Row and Column profile plots in which the image cursor is used to define the range of lines to be averaged. The available averaging modes are described in the table below.
Creating an averaged plot involves 2 steps:
Select the averaging mode from the Averaging Mode submenu. This selection persists until you change it again.
Make the plot from the Horizontal or Vertical plot menu or toolbar button.
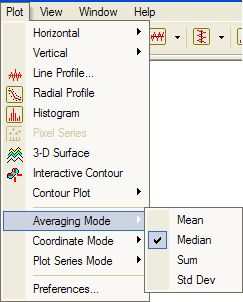
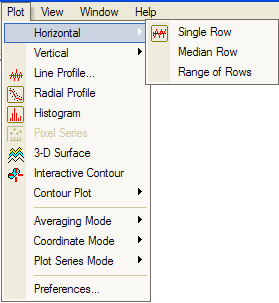
As shown below, selecting an averaging mode (left picture) inserts the specific command name into the plotting menu (right picture). In this case, the Median averaging mode is selected, and the Horizontal plotting menu shows the Median Plot command.
Mira supports the following averaging modes:
Plot Averaging Modes
|
Mean |
Calculates the arithmetic mean value of the adjacent columns or rows. |
|
Median |
Calculates the median value at each point in the adjacent columns or rows. |
|
Sum |
Adds the lines to make a single column or row that is the sum of adjacent columns or rows. This method is often used when extracting a spectrum from a 2-D image. |
|
Std Dev |
Combines adjacent lines to get the standard deviation at each point alonghte line. |
On the plot, the averaging mode that was used is identified by the plot label (see Plotting an Averaged Line).