Plot Properties
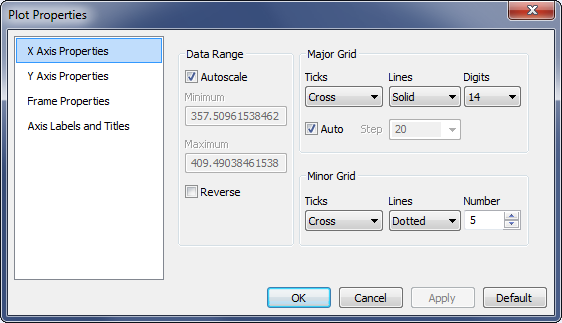
The Plot Properties dialog allows you to change the appearance of the plot. On the various pages of the dialog you can change the axis scaling, the tick marks, labels, fonts, colors, and more.
Open the Plot Properties dialog use one of these methods.
X Axis Properties configures the X axis extent, major and minor ticks.
Y Axis Properties configures the Y axis extent, major and minor ticks.
Frame Properties configures the appearance of the plot frame, including fonts, colors, and lines.
Axis Labels and Titles configures the plot labels and captions.
|
Buttons on the Plot Properties Dialog |
|
|
[OK] |
Applies your changes and closes the dialog. |
|
[Cancel] |
Discards your changes and closes the dialog. |
|
[Apply] |
Applies your changes to the calling procedure in the parent Image Window. |
|
[Default] |
Applies your changes to the calling procedure in the parent Image Window and saves them as default properties. |