histplot
The histplot function computes the histogram of an array and graphs it as a stepped line plot. The histogram of n values is automatically quantized into the square root of n bins. This function is an efficient method for plotting the histogram of a data sample without writing code to set binning parameters, compute the hstogram, and then graph the result.
This function creates a new plot window and returns a CPlotView object for the window and a CPlot object to access the plot window and plot series for further processing.
CPlotView, CPlot = histplot( t )
CPlotView, CPlot = histplot( t, sLabelX )
CPlotView, CPlot = histplot( t, sLabelX, sLabelY )
CPlotView, CPlot = histplot( t, sLabelX, sLabelY, sCaption )
CPlotView, CPlot = histplot( t, sLabelX, sLabelY, sCaption, sWindowTitle )
![]() t is a 1-dimensional array containing the
values to plot as a histogram.
t is a 1-dimensional array containing the
values to plot as a histogram.
![]() sLabelX is an optional label for the x
axis.
sLabelX is an optional label for the x
axis.
![]() sLabelY is an
optional label for the y axis.
sLabelY is an
optional label for the y axis.
![]() sCaption is an optional plot caption.
sCaption is an optional plot caption.
![]() sWindowTitle is an optional plot window
title.
sWindowTitle is an optional plot window
title.
![]() Parameters that are nil or missing to the right adopt default
values.
Parameters that are nil or missing to the right adopt default
values.
Return values:
![]() CPlotView
is returned as a new CPlotView object attached to the plot window.
It is nil on failure.
CPlotView
is returned as a new CPlotView object attached to the plot window.
It is nil on failure.
![]() CPlot is
returned as a new CPlot object attached to the current plot series. It
is nil on failure.
CPlot is
returned as a new CPlot object attached to the current plot series. It
is nil on failure.
This function creates a quick plot using just one line of code. The returned values of V (CPlotView object) and P (CPlot object) provide access to the plot window and plotted data. After the plot is created, the Series Attributes and Plot Attributes can be changed using methods of the V and P objects.
Only the first argument, the source array, is required. To specify a later argument, such as sWindowTitle, without specifying all intervening arguments, use nil as a placeholder for the missing arguments.
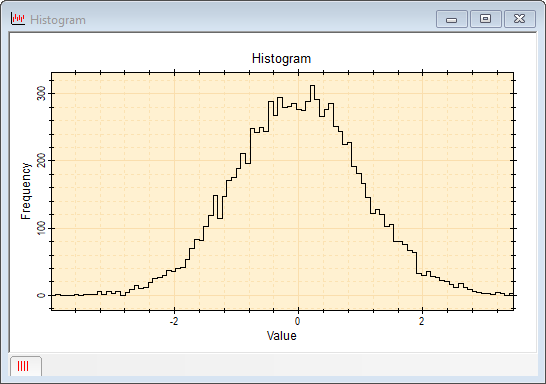
The script below plots the histogram of random Guassian deviates. The plot will show a Gaussian distribution which includes statistical noise; the greater the number of deviates, the smaller the statistical noise will appear.
|
|
-- 10,000 deviates with mean = 1000 and sdev = 33 |
|
|
-- plot the histogram using default labels |
This script could be reduced to one line, like this:
|
|
-- plot the histogram using default labels |
Mira Pro x64 Script User's Guide, v.8.80 Copyright Ⓒ 2025
Mirametrics, Inc. All Rights Reserved.