Comparison of non-Class Plotting Functions
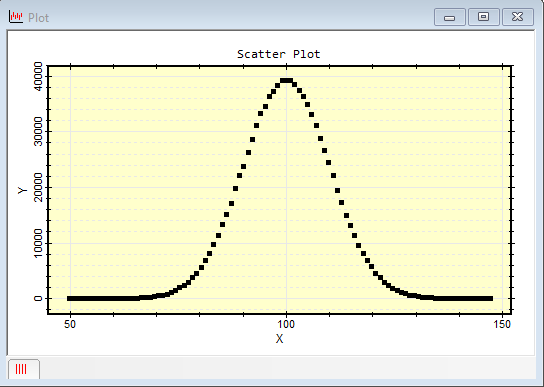
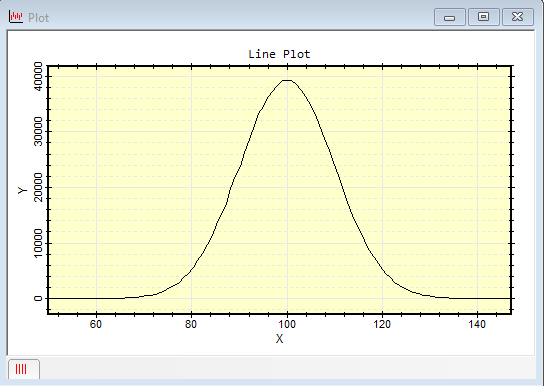
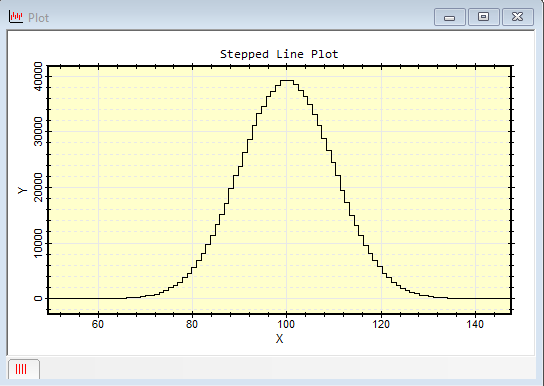
The non-class plotting functions expedite plotting arrays (indexed tables) outside of the CPlotView class when you do not need to make specialized or complex changes to the plot appearance. These 4 functions include scatter, connect, line, and stepline. The pictures below were made using the same arrays of 20 random x and y values. In this example, the arrays were sorted using table.sort() before plotting so that the random values were increasing in both x and y. The scatter function also includes y error bars.
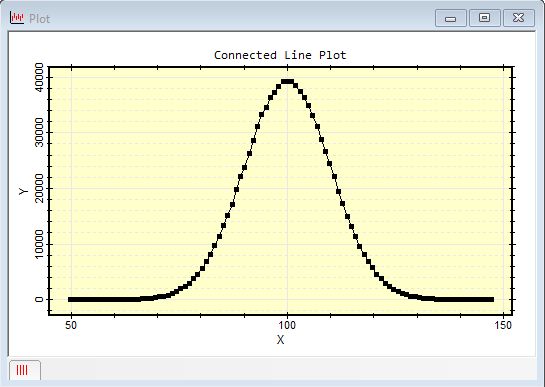
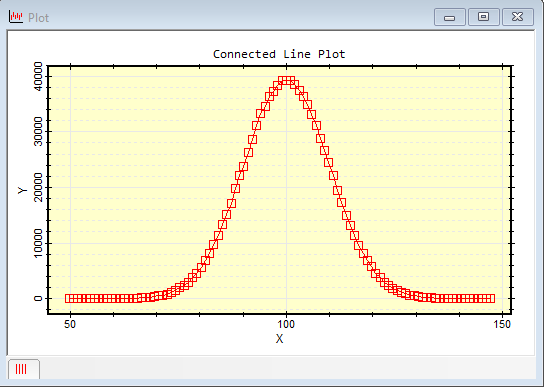
The plot symbols and attributes are set initially using the "View > Default Properties > Image Plots" menu command. They can also be changed after plotting using the "View > Series Attributes" command for the Plot Window. For example, the connected line plot above was altered using the Series Attributes command to use red color, and unfilled markers of 6-point size:
To get hybrid plots that merge two or more types, you can run one plotting function and then another on the same data. Then use the Ctrl+C and Ctrl+V (edit > copy and edit > paste) commands to copy and paste one or more plots (one at a time) onto one chosen as the "master" plot. The individual plots are shown together by switching to Overlay mode.
Mira Pro x64 Script User's Guide, v.8.77 Copyright Ⓒ 2024
Mirametrics, Inc. All Rights Reserved.