CPlotView:PlotStepLine
The PlotStepLine method draws points in a new plot window. The points are drawn as stepped line segments. The line attributes are set in the "View > Default Properties > Image Plots" dialog. The related StepLine method takes its data from x and y tables rather than the CPlotView class data matrix.
CPlot = CPlotView:PlotStepLine()
CPlot = CPlotView:PlotStepLine( sX )
CPlot = CPlotView:PlotStepLine( sX, sY )
CPlot = CPlotView:PlotStepLine( sX, sY, sTitle )
CPlot = CPlotView:PlotStepLine( sX, sY, sTitle, sCaption )
![]() sX is the
optional x axis label. If nil, a default is used.
sX is the
optional x axis label. If nil, a default is used.
![]() sY is the
optional y axis label. If nil, a default is used.
sY is the
optional y axis label. If nil, a default is used.
![]() sTitle is
the optional window title. If nil, a default is used.
sTitle is
the optional window title. If nil, a default is used.
![]() sCaption is
the optional plot caption. If nil, a default is used.
sCaption is
the optional plot caption. If nil, a default is used.
Return value:
![]() CPlot is a new CPlot object
attached to the current plot series. It is nil on failure.
CPlot is a new CPlot object
attached to the current plot series. It is nil on failure.
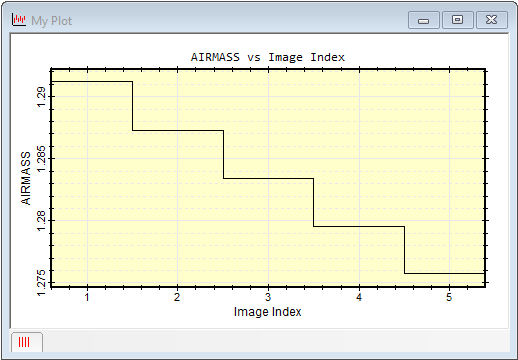
The plot below shows a step-line plot without error bars. To add error bars, specify them in the call to the CPlotView:Add method. To plot the same data as a line plot, use the CPlotLine method. To plot the same data as a scatterplot with only markers, use the PlotScatter method. To draw both markers and line segments, use the PlotConnected method.

The plot above was created using the script below. The CImageView V was selected from a drop-list of all open image windows, and an image set was chosen. The header keyword AIRMASS was chosen for the x-axis. You could choose any keyword in the headers, or plot against some other value.
|
|
-- select an image view from open windows |
|
|
-- Returns a reference V for the CmageView |
|
|
-- exit if V is nil |
|
|
-- Get the keyword to plot |
|
|
-- default keyword |
|
|
|
|
|
|
|
|
-- loop over all images in the CImageView: |
|
|
-- save index of top image |
|
|
|
|
|
-- Change to the i-th image |
|
|
-- get a reference to the image at index i |
|
|
-- if the image is good (it should be!) |
|
|
-- x plot value is the image index. |
|
|
-- y plot value is the keyword value |
|
|
-- add the point to the collection |
|
|
|
|
|
|
|
|
-- reset the image window to the starting image |
|
|
|
|
|
-- Create caption above the plot for Overplot mode |
|
|
-- plot points with X label, Y label, Title, and Caption |
|
|
-- specify the title and other labels |
CPlotView class, PlotConnected, PlotLine, PlotScatter, PlotPoints
Mira Pro x64 Script User's Guide, Copyright Ⓒ 2024 Mirametrics,
Inc. All Rights Reserved.