histplot
The histplot function computes the histogram of an array and graphs it as a stepped line plot. This is an efficient non-class equivalent to using several lines of script to create a histogram, calculate the binning parameters, and plot it. The histogram object is computed internally and is not available to the script.
This function creates a new plot window and returns a CPlotView object and a CPlot object for the plot and the plot series it creates. These objects can be used to enhance or add to the plot or extract plot data for further analysis.
CPlotView, CPlot = histplot( t )
CPlotView, CPlot = histplot( t, sLabelX )
CPlotView, CPlot = histplot( t, sLabelX, sLabelY )
CPlotView, CPlot = histplot( t, sLabelX, sLabelY, sCaption )
CPlotView, CPlot = histplot( t, sLabelX, sLabelY, sCaption, sWindowTitle )
![]() t is a 1-dimensional array containing the
values to plot as a histogram.
t is a 1-dimensional array containing the
values to plot as a histogram.
![]() sLabelX is an optional label for the x
axis.
sLabelX is an optional label for the x
axis.
![]() sLabelY is an
optional label for the y axis.
sLabelY is an
optional label for the y axis.
![]() sCaption is an optional plot caption.
sCaption is an optional plot caption.
![]() sWindowTitle is an optional plot window
title.
sWindowTitle is an optional plot window
title.
![]() Parameters that are nil or missing to the right adopt default
values.
Parameters that are nil or missing to the right adopt default
values.
Return values:
![]() CPlotView
is returned as a new CPlotView object attached to the plot window.
It is nil on failure.
CPlotView
is returned as a new CPlotView object attached to the plot window.
It is nil on failure.
![]() CPlot is
returned as a new CPlot object attached to the current plot series. It
is nil on failure.
CPlot is
returned as a new CPlot object attached to the current plot series. It
is nil on failure.
This function creates a quick plot using just one line of code. The returned values of V and P provide access to the plot window and plotted data. You can also change the plot properties including the marker attributes, labels, scaling, and others using commands such as Series Attributes and Plot Attributes.
Only the first argument, the array to plot as a histogram, is required. If you want to use the other arguments, you must include a nil placeholder to fill any holes between the arguments.
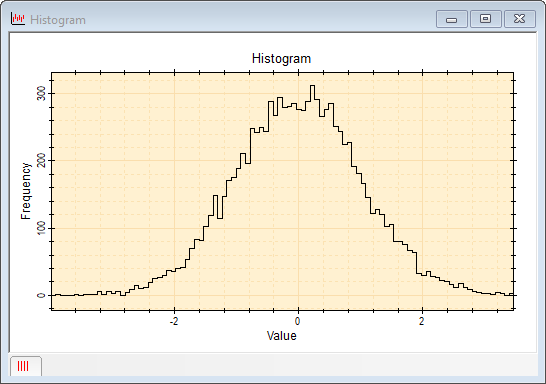
The script below plots the histogram of random Guassian deviates. Since none of the optional parameters is used, only the array needs to be specified. The plot will show a Gaussian distribution with noise. The greater the number of deviates computed, the lower the statistical noise.
|
|
-- 10,000 deviates with mean = 1000 and sdev = 33 |
|
|
-- create the histogram and plot it |
plot, scatter, line, connect, stepline, CPlotView class, CHistogram class, Plotting Functions
Mira Pro x64 Script User's Guide, Copyright Ⓒ 2023 Mirametrics,
Inc. All Rights Reserved.