CPlotView:Scatter
The Scatter method creates a scatter plot using markers for data points. This is a CPlotView class version pf the non-class scatter function. The x and y points at the same array index are presumed to correspond to the same point. This function also can plot x and y error bars. The data for x, y, and the x and y error bars are each held in a 1-dimensional array. The example below adds a script for using y error bars. Error bars can also be used by the Line, Connect, and Stepline methods. The PlotScatter method takes its data from the CPlotView class data matrix rather than from x and y tables. Also see the Connect, Line, and StepLine commands in the CPlotView class.
This function creates a new plot window and returns a CPlot object for the plot series it creates. This object can be used to enhance or add to the plot or extract plot data for further analysis.
CPlot = CPlotView:Scatter( x, y )
CPlot = CPlotView:Scatter( x, y, xe )
CPlot = CPlotView:Scatter( x, y, xe, ye )
CPlot = CPlotView:Scatter( x, y, xe, ye, sLabelX )
CPlot = CPlotView:Scatter( x, y, xe, ye, sLabelX, sLabelY )
CPlot = CPlotView:Scatter( x, y, xe, ye, sLabelX, sLabelY, sCaption )
CPlot = CPlotView:Scatter( x, y, xe, ye, sLabelX, sLabelY, sCaption, sWindowTitle )
![]() x is a 1-dimensional array containing the x
values.
x is a 1-dimensional array containing the x
values.
![]() y is a 1-dimensional array containing the x
values.
y is a 1-dimensional array containing the x
values.
![]() xe is an optional 1-dimensional array
containing the x error bar values.
xe is an optional 1-dimensional array
containing the x error bar values.
![]() ye is an optional 1-dimensional array
containing the y error bar values.
ye is an optional 1-dimensional array
containing the y error bar values.
![]() sLabelX is an optional label for the x
axis.
sLabelX is an optional label for the x
axis.
![]() sLabelY is an
optional label for the y axis.
sLabelY is an
optional label for the y axis.
![]() sCaption is an optional plot caption.
sCaption is an optional plot caption.
![]() sWindowTitle is an optional plot window
title.
sWindowTitle is an optional plot window
title.
![]() Parameters that are nil or missing to the right adopt default
values.
Parameters that are nil or missing to the right adopt default
values.
Return values:
![]() CPlot is a
new CPlot
object attached to the current plot series. It is nil on failure.
CPlot is a
new CPlot
object attached to the current plot series. It is nil on failure.
The returned parameters permit access to the plotted data. You can also change the plot properties including the marker attributes, labels, scaling, and others using commands such as Series Attributes and Plot Attributes.
Only the first 2 arguments, the (x,y) data, are required. If you want to use the other arguments, you must include a placeholder to fill any holes between the arguments. For example, to include y error bars but not x error bars, use nil in place of the xe parameter.
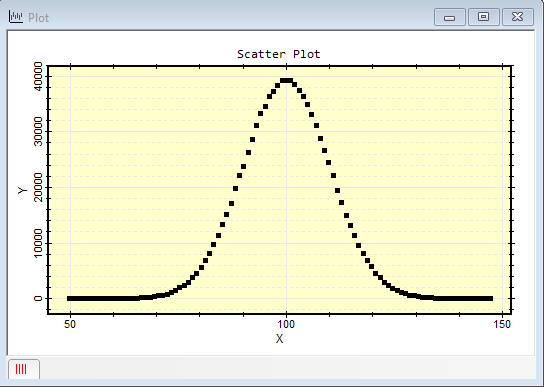
The script below creates some data from the random number generator and creates a scatter plot with default plot labels. Since none of the optional parameters is used, only the x and y arrays need to be specified.
|
|
-- create a new CPlotView object |
|
|
-- 10 values between 10 and 20 |
|
|
-- 10 values between 20 and 40 |
|
|
-- create the scatter plot |
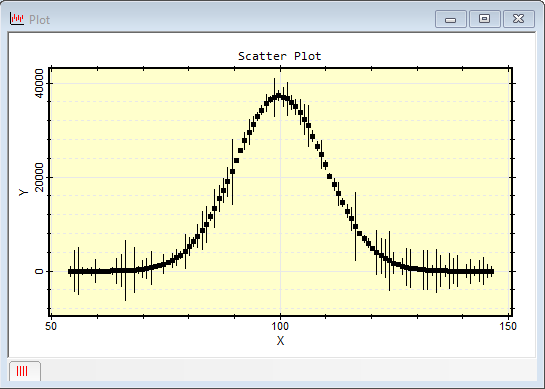
The next example creates a scatter plot of 1 million Gaussian Deviates including error bars on the y axis. The deviates have a standard deviation of 10 and mean of 100. A table for y errors bars is also created with a standard deviation of 3000 and mean of 0. The table for error bars is made to the same number of elements as the x-axis table x. This plot is the second one shown above.
|
|
-- create a new CPlotView object |
|
|
-- create 1 million Gaussian deviates |
|
|
-- create a histogram object |
|
|
-- calculate the hstogram of the deviates |
|
|
-- separate the 3 parameters for clarity |
|
|
|
|
|
|
|
|
-- create a series for the histgram x axis |
|
|
-- add a table for y error bars |
|
|
-- create the scatter plot with y error bars |
CPlotView class, non-class scatter function, Plotting Functions, Comparison of non-Class Plotting Functions
Mira Pro x64 Script User's Guide, Copyright Ⓒ 2023 Mirametrics,
Inc. All Rights Reserved.