CPlotView:PlotLine
The PlotLine method draws points in a new plot window. The points are drawn as line segments. The line attributes are set in the "View > Default Properties > Image Plots" dialog. The related Line method takes its data from x and y tables rather than the CPlotView class data matrix.
CPlot = CPlotView:PlotLine()
CPlot = CPlotView:PlotLine( sX )
CPlot = CPlotView:PlotLine( sX, sY )
CPlot = CPlotView:PlotLine( sX, sY, sTitle )
CPlot = CPlotView:PlotLine( sX, sY, sTitle, sCaption )
![]() sX is the
optional x axis label. If nil, a default is used.
sX is the
optional x axis label. If nil, a default is used.
![]() sY is the
optional y axis label. If nil, a default is used.
sY is the
optional y axis label. If nil, a default is used.
![]() sTitle is
the optional window title. If nil, a default is used.
sTitle is
the optional window title. If nil, a default is used.
![]() sCaption is
the optional plot caption. If nil, a default is used.
sCaption is
the optional plot caption. If nil, a default is used.
Return value:
![]() CPlot is a new CPlot object
attached to the current plot series. It is nil on failure.
CPlot is a new CPlot object
attached to the current plot series. It is nil on failure.
The plot below shows a line plot without error bars. To add error bars, specify them in the call to the CPlotView:Add method. To plot the same data as a scatterplot with only markers use the PlotScatter method. To draw stepped lines, use the PlotSteptLine method. To draw both markers and line segments, use the PlotConnected method.
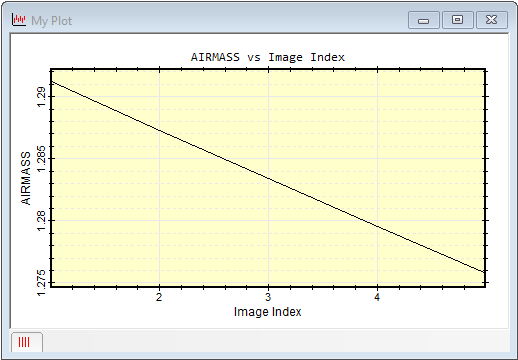
The plot above was created using the script below. The CImageView V was selected from a drop-list of all open image windows, and an image set was chosen. The header keyword AIRMASS was chosen for the x-axis. You could choose any keyword in the headers, or plot against some other value.
|
|
-- select an image view from open windows |
|
|
-- Returns a reference V for the CmageView |
|
|
-- exit if V is nil |
|
|
-- Get the keyword to plot |
|
|
-- default keyword |
|
|
|
|
|
|
|
|
-- loop over all images in the CImageView: |
|
|
-- save index of top image |
|
|
|
|
|
-- Change to the i-th image |
|
|
-- get a reference to the image at index i |
|
|
-- if the image is good (it should be!) |
|
|
-- x plot value is the image index. |
|
|
-- y plot value is the keyword value |
|
|
-- add the point to the collection |
|
|
|
|
|
|
|
|
-- reset the image window to the starting image |
|
|
|
|
|
-- Create caption above the plot for Overplot mode |
|
|
-- plot points with X label, Y label, Title, and Caption |
|
|
-- specify the title and other labels |
CPlotView class, PlotConnected, PlotStepLine, PlotScatter, PlotPoints
Mira Pro x64 Script User's Guide, Copyright Ⓒ 2023 Mirametrics,
Inc. All Rights Reserved.