Transfer Function Popup Menus
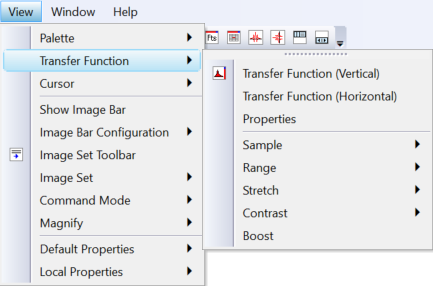
Transfer Function settings can be changed from popup windows similar to the way they are changed using the Transfer Function Pane and Transfer Function Properties dialog. One of the menus is shown below. All of the properties in this menu tree are described under Transfer Function Definition. All of the menu commands may be set using the horizontal or vertical transfer function panes.

Some of the menu items require more information. The menu items Specify %, Specify Z, and Specify Gamma (not shown above) open the dialogs shown below to request the required values.
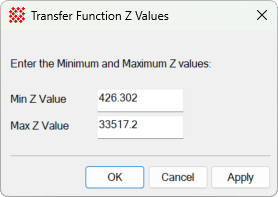
Figure 1. Min Z and Max Z are the minimum and maximum pixel values for the transfer function. These values are determined inside the transfer function sample region selected using the Sample menu options.

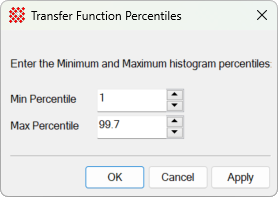
Figure 2. Min % and Max % are the minimum and maximum pixel value percentages for the transfer function. To compute the corresponding pixel values, the image histogram must first be computed. These values are determined from the histogram inside the transfer function sample region selected using the Sample menu options. The values 0 and 100 correspond to the Min Z and Max Z values in Figure 1.

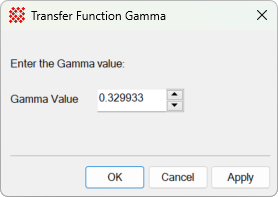
Figure 3. The gamma value shapes the transfer function between the limits determined in Figure 1 or Figure 2. A gamma value of 1.0 corresponds to a linear transfer function. A value of gamma less than 1 enhances contrast in the histogram below middle gray.

Choosing Transfer Function Properties
Mira Pro x64 8.67 User's Guide, Copyright Ⓒ 2023 Mirametrics, Inc.
All Rights Reserved.