Use the ![]() button to
control the contours by setting Contour Plot Properties such as
level values and colors.
button to
control the contours by setting Contour Plot Properties such as
level values and colors.
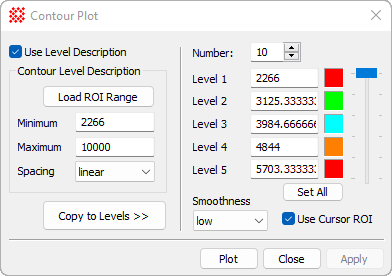
Contour Plot Properties
The Contour Plot Properties including the level values and colors are configured in this dialog. Clicking [Plot] generates the contours based on the present settings. Clicking [Apply] saves the properties as default values for future contouring. The contour example above was created using the properties in the dialog below. In this example, specific intensity contours were not required, so a reasonable spacing was selected using options in the left side of the dialog. The minimum and maximum were specified, a linear spacing selected, followed by [Copy to Levels >>].
Use the ![]() button to
control the contours by setting Contour Plot Properties such as
level values and colors.
button to
control the contours by setting Contour Plot Properties such as
level values and colors.
You may want to create contours at specific intensity values, or you may want to simply choose limits and let Mira compute the levels between. This is why the dialog is divided into a left and right hand portions:
The left side of the Contour Plot dialog has controls for calculating the contour levels from a description involving the minimum level, maximum level, and a method for spacing them between the limits.
The right side of the Contour Plot dialog contains the levels and other Properties that are used to generate the contours. You can type in the values yourself or you can have Mira calculate the levels using the Description Properties from the left side of the dialog.
|
Contour Plot Properties |
|
|
Number |
The number of contours. |
|
Level [n] |
The value and color for the n-th contour level. Only 5 contour settings are visible; a selection scrollbar appears when more than 5 contours are specified. |
|
Set All |
Sets all contours to the same color. |
|
Smoothness |
Select the smoothness of the contours. |
|
Use Cursor ROI |
Check this option to contour only the region inside the image cursor. |
|
Use Level Description |
Check this option to enable the description fields on the left side of the dialog. This is a safety feature that prevents unintentional setting of contour levels. |
|
Load ROI Range |
Optionally loads the Minimum and Maximum fields using values measured inside the Region of Interest defined by the Image Cursor. |
|
Minimum |
The minimum value of the contour description. |
|
Maximum |
The maximum value of the contour description. |
|
Copy to Levels >> |
Computes the contour levels from the description Properties and copies the results into the level [n] fields. |
Mira Pro x64 User's Guide, Copyright Ⓒ 2023 Mirametrics, Inc. All
Rights Reserved.